Manager
The Manager report contains the following pages:
Contact Center
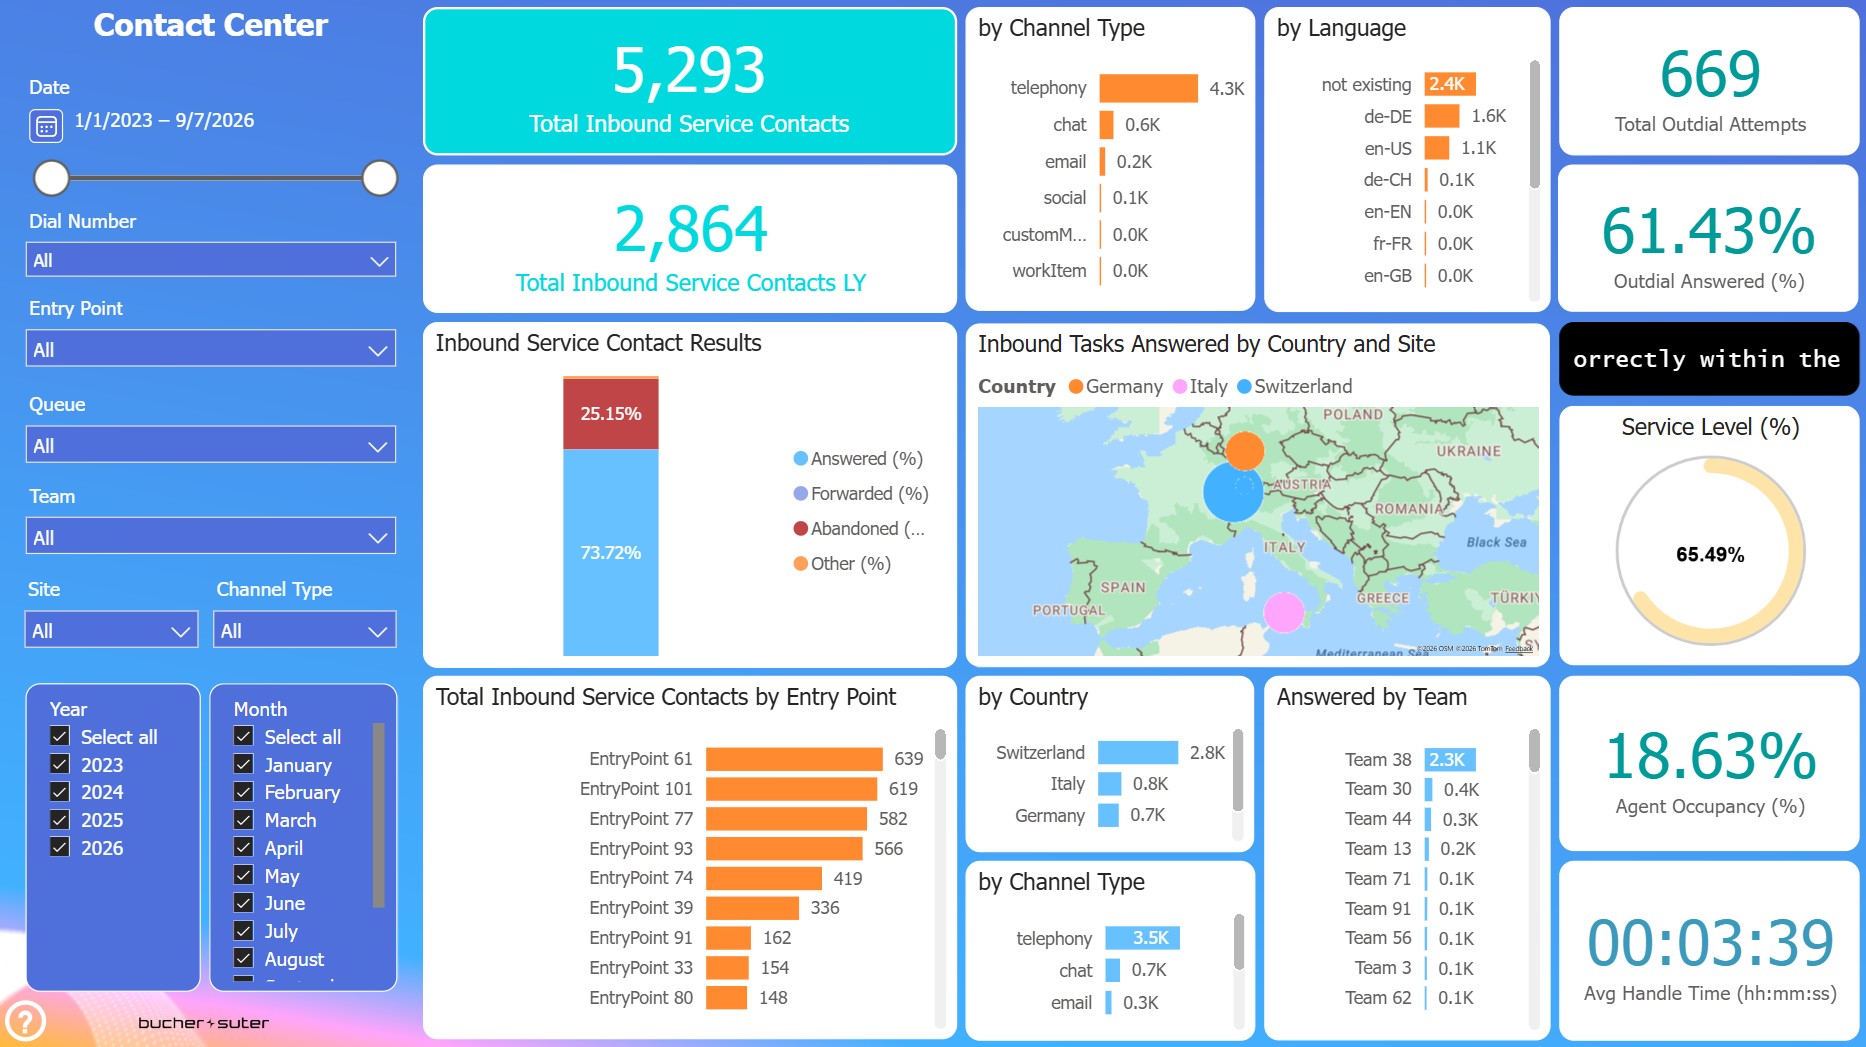
This report gives you a first overview about the whole Contact Center system at a glance.
You can easily see what is going on overall and it also contains the main slicer (filter) page.
Longterm Overview
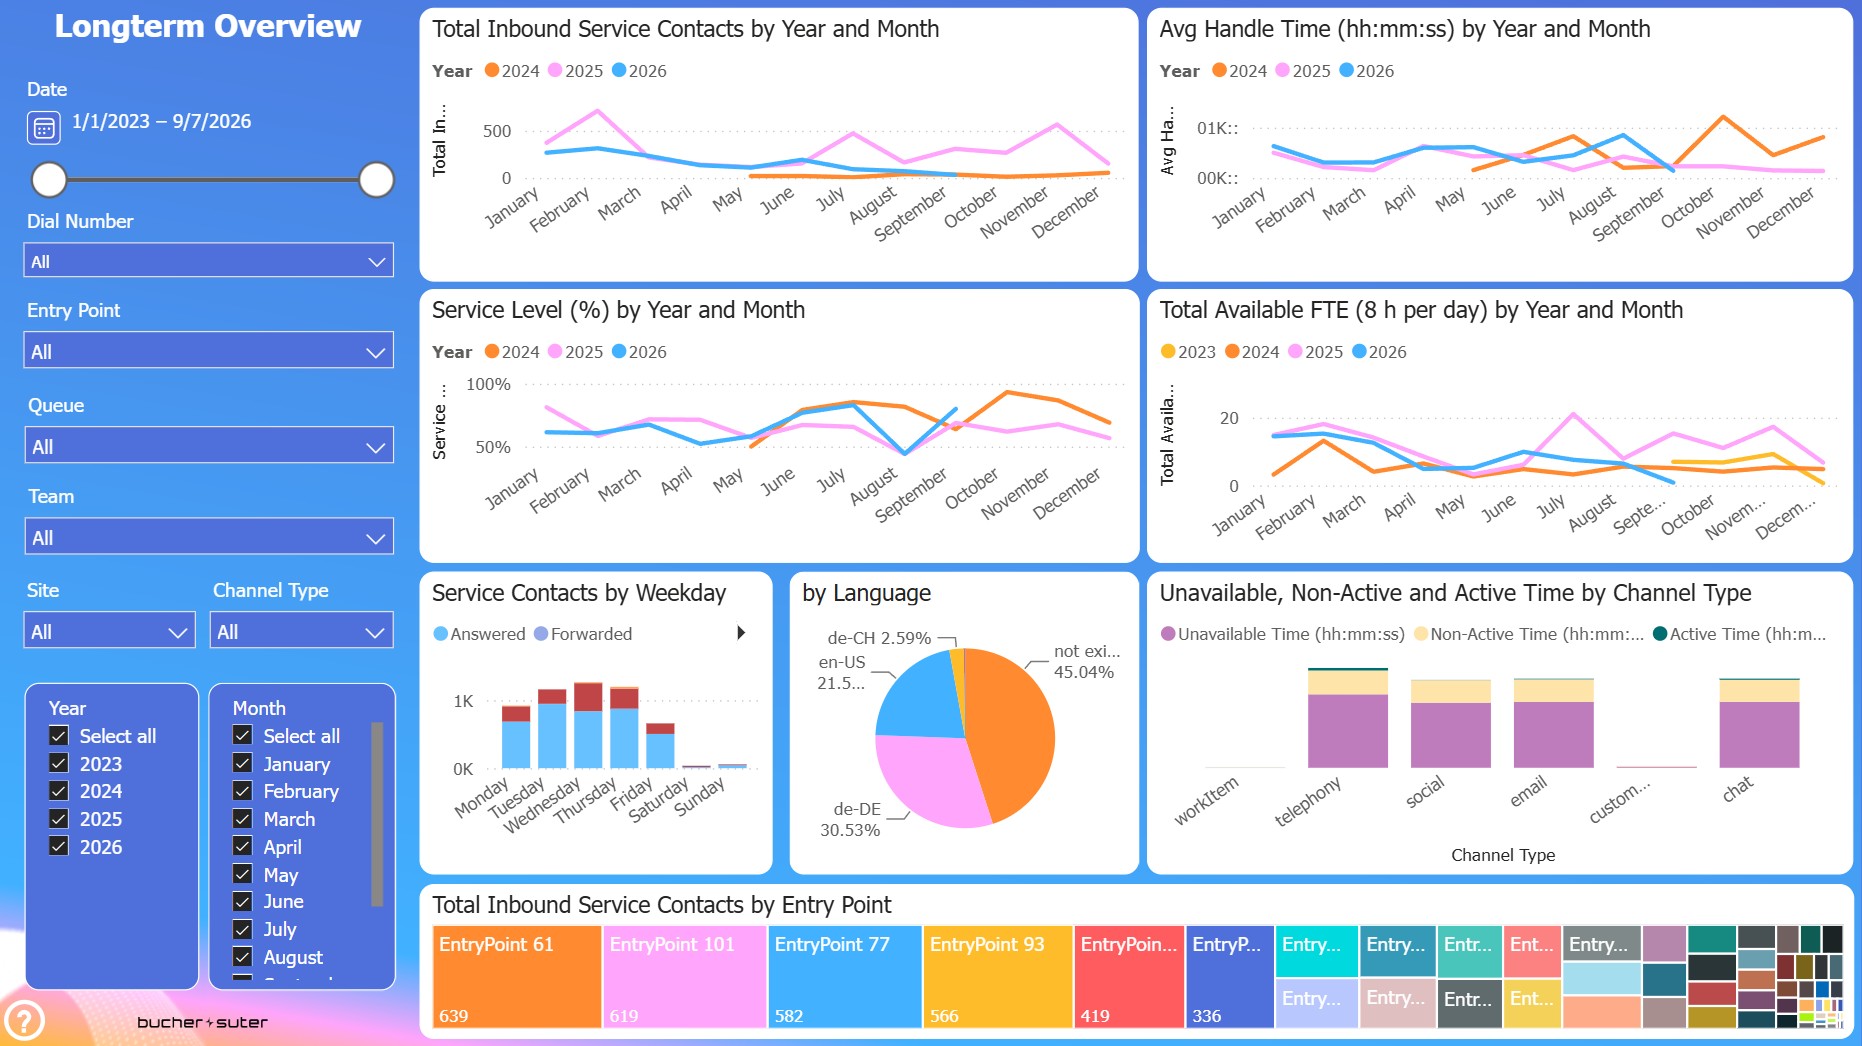
This report can be used to compare data between multiple years. To do so, the filter must be adjusted to include more than one year of data.
Last Year Comparison
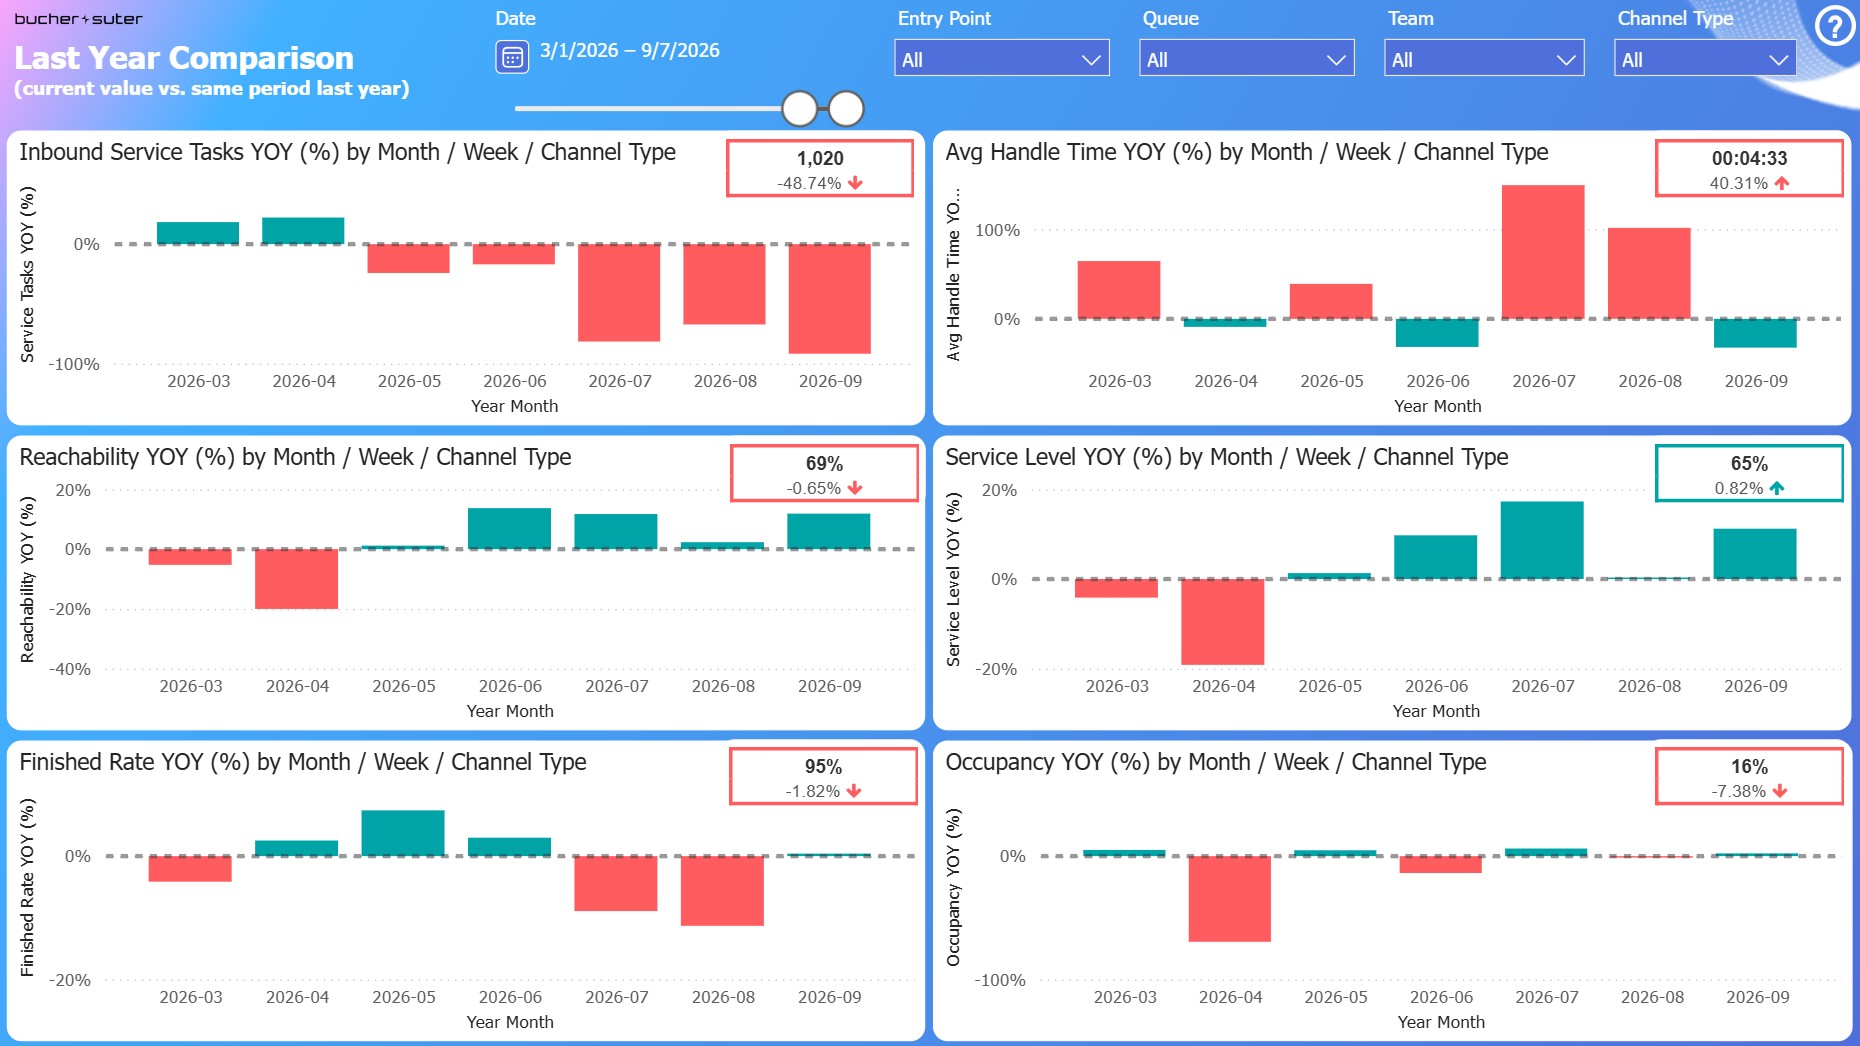
This report displays the Year-Over-Year (YOY) values of some main KPIs over time and per channel type (on the last hierarchy level). YOY is the difference of the current value compared with the same period of the last year in percentage (+/- %).
If the current value of a KPI is better than last year, the YOY (%) is displayed in green, otherwise in red. Volumes are green if they are higher than last year.
The KPI visual in the top right-hand corner of each visual displays the current value and the YOY value with its tendency over the selected period.
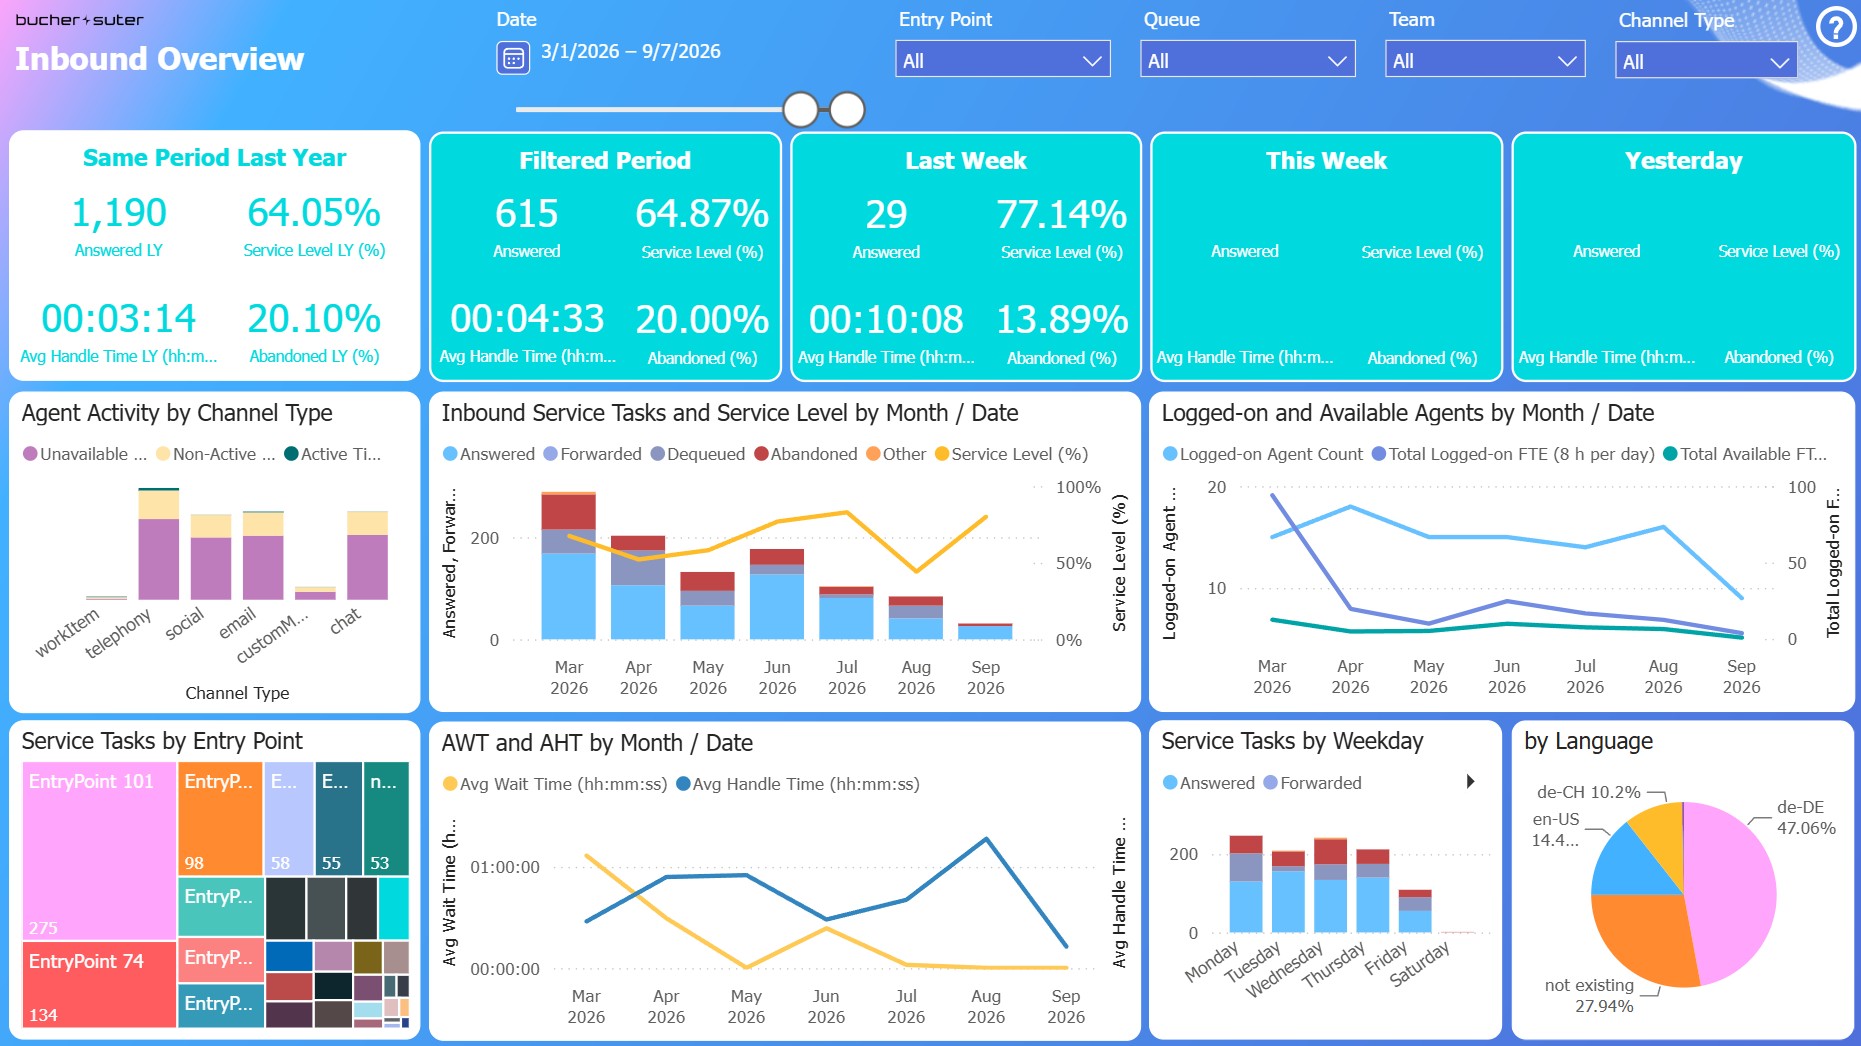
Inbound Overview
This report gives you an overview about the most important KPIs for Contact Center inbound tasks over a shorter period.
Inbound Performance
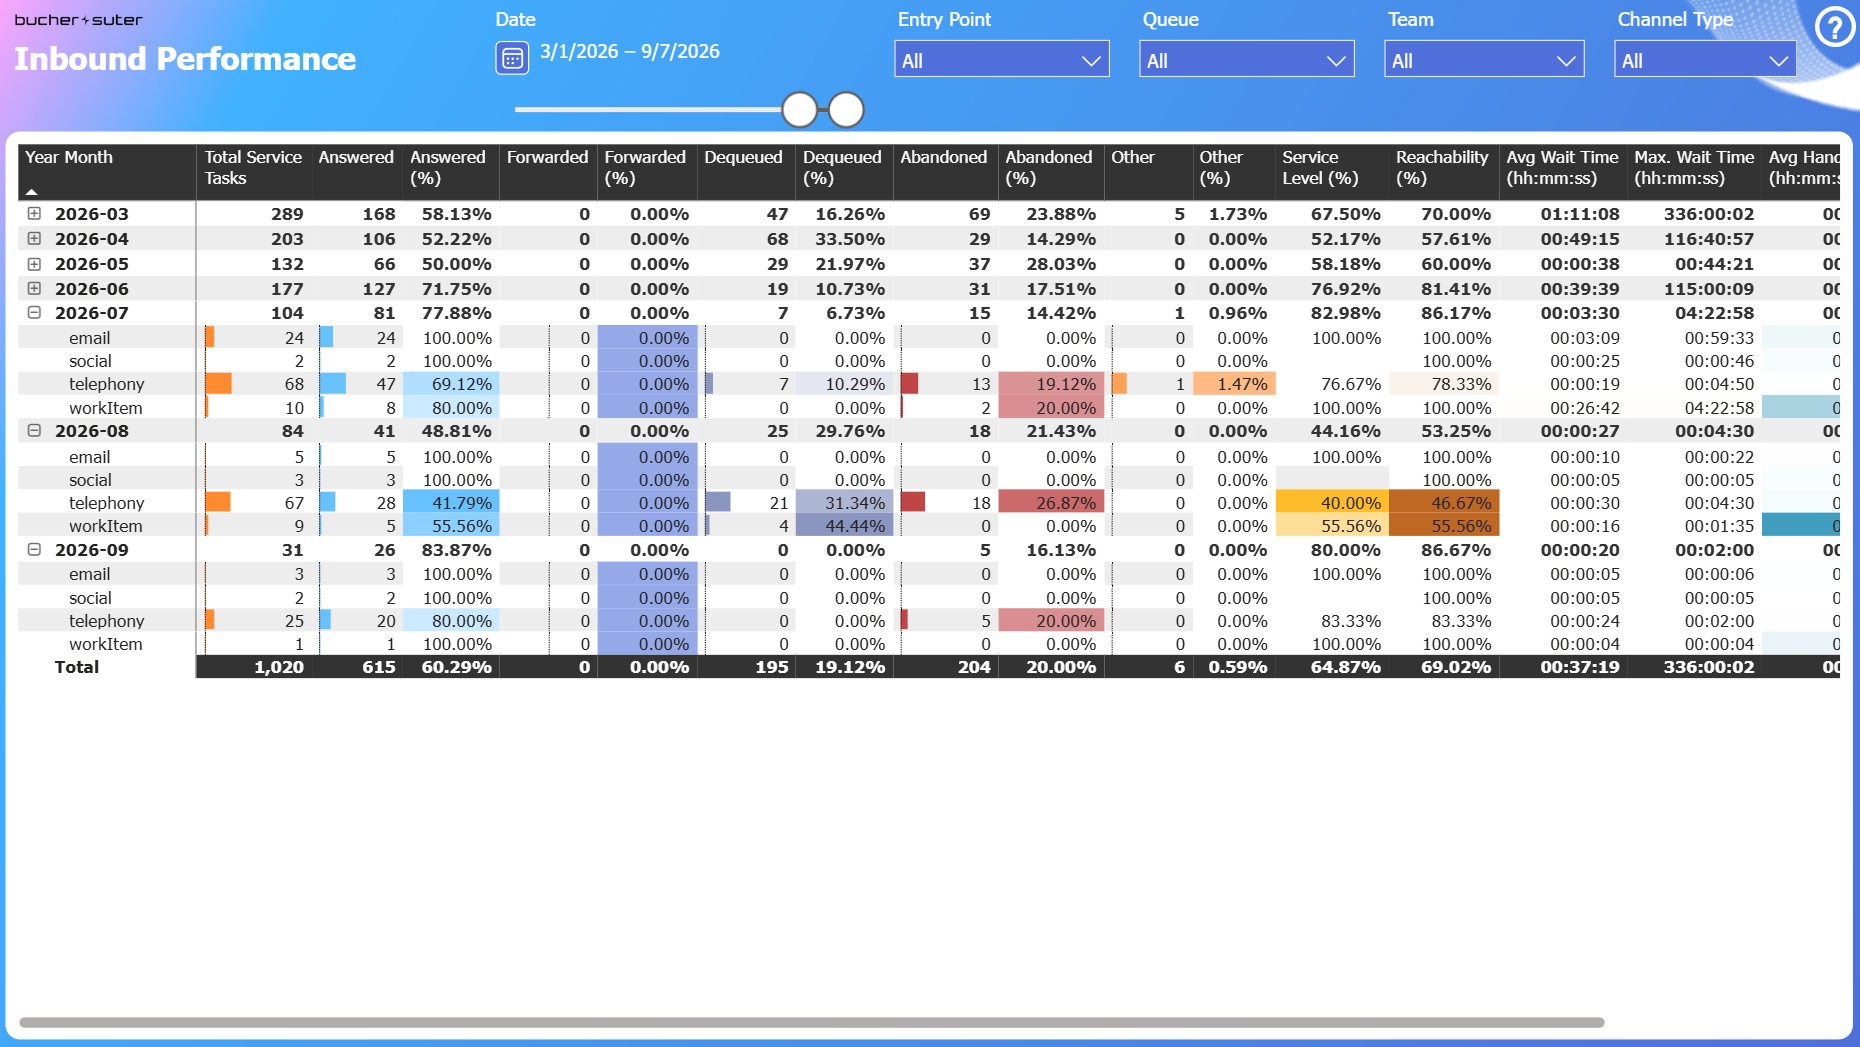
Use this report to see the available measures for Contact Center inbound tasks in a tabular format including some groupings and conditional formatting.
Inbound Answered by Wrapup Code
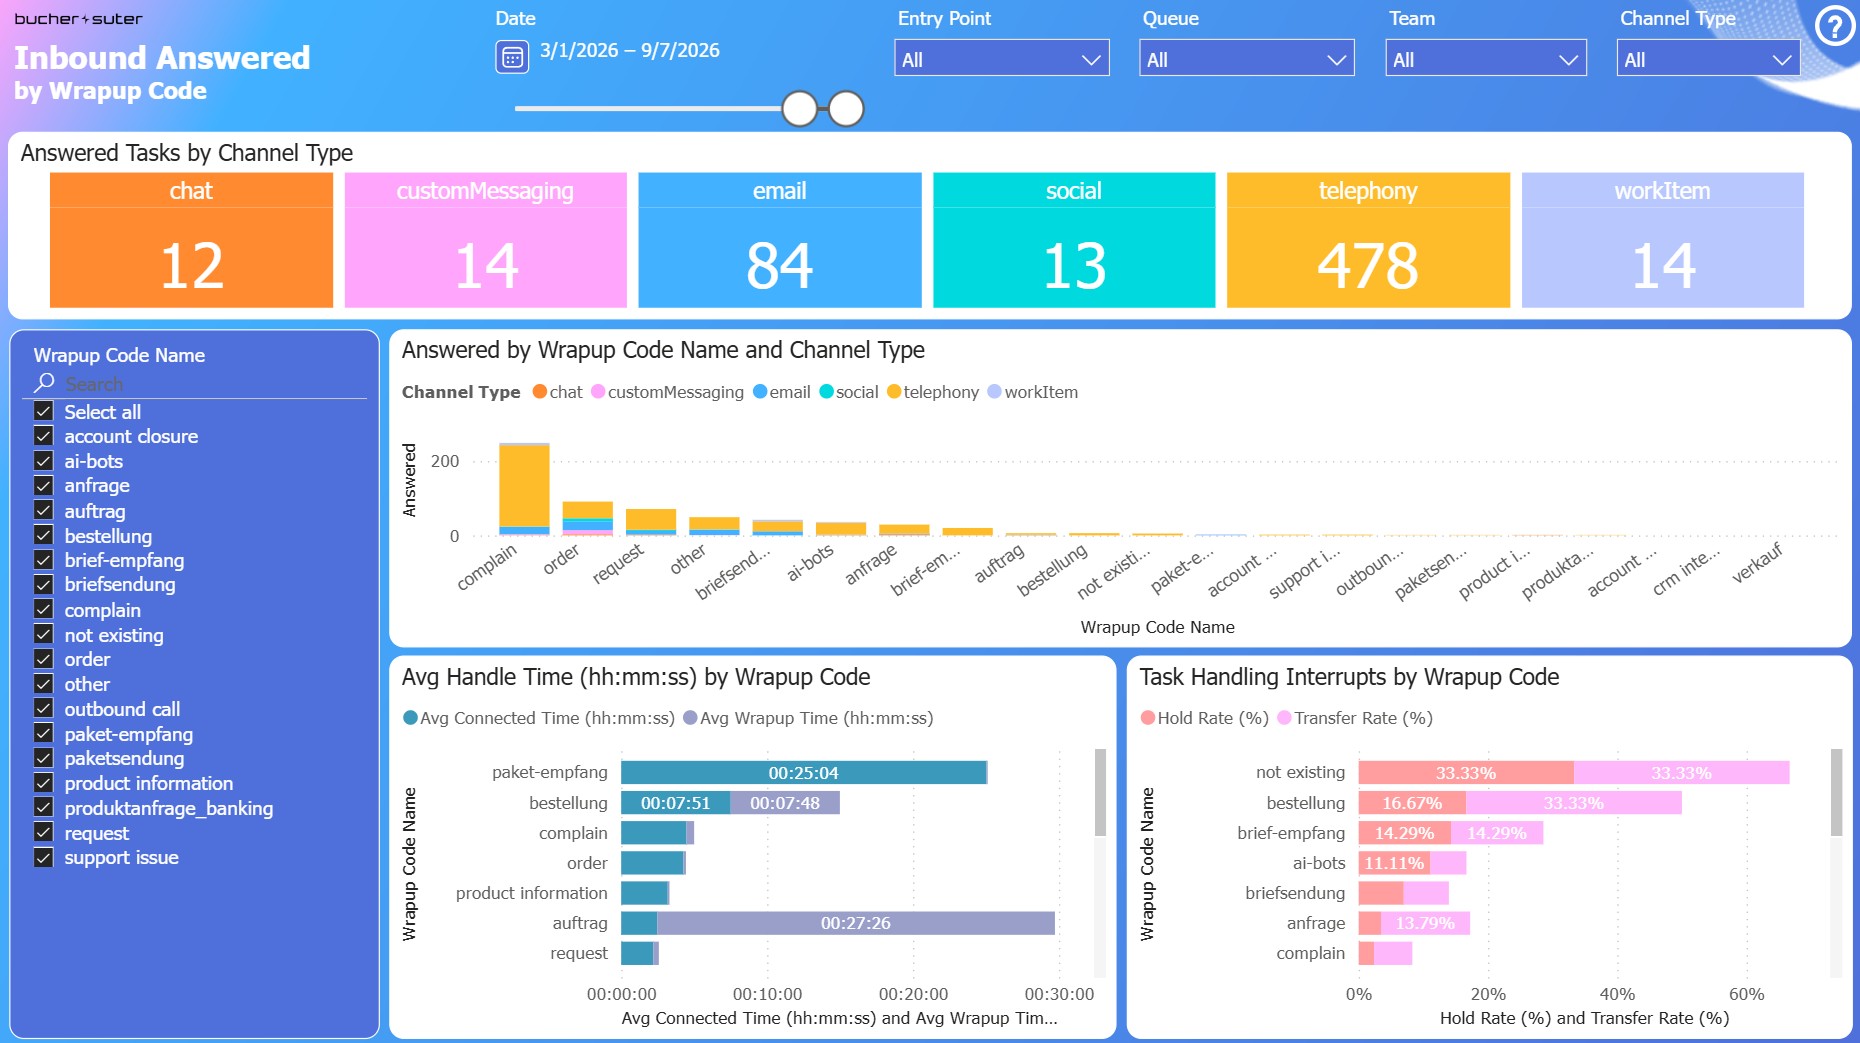
This report displays the volume and duration for all of your classified inbound tasks by their wrapup code and channel type.
Transfer Destinations
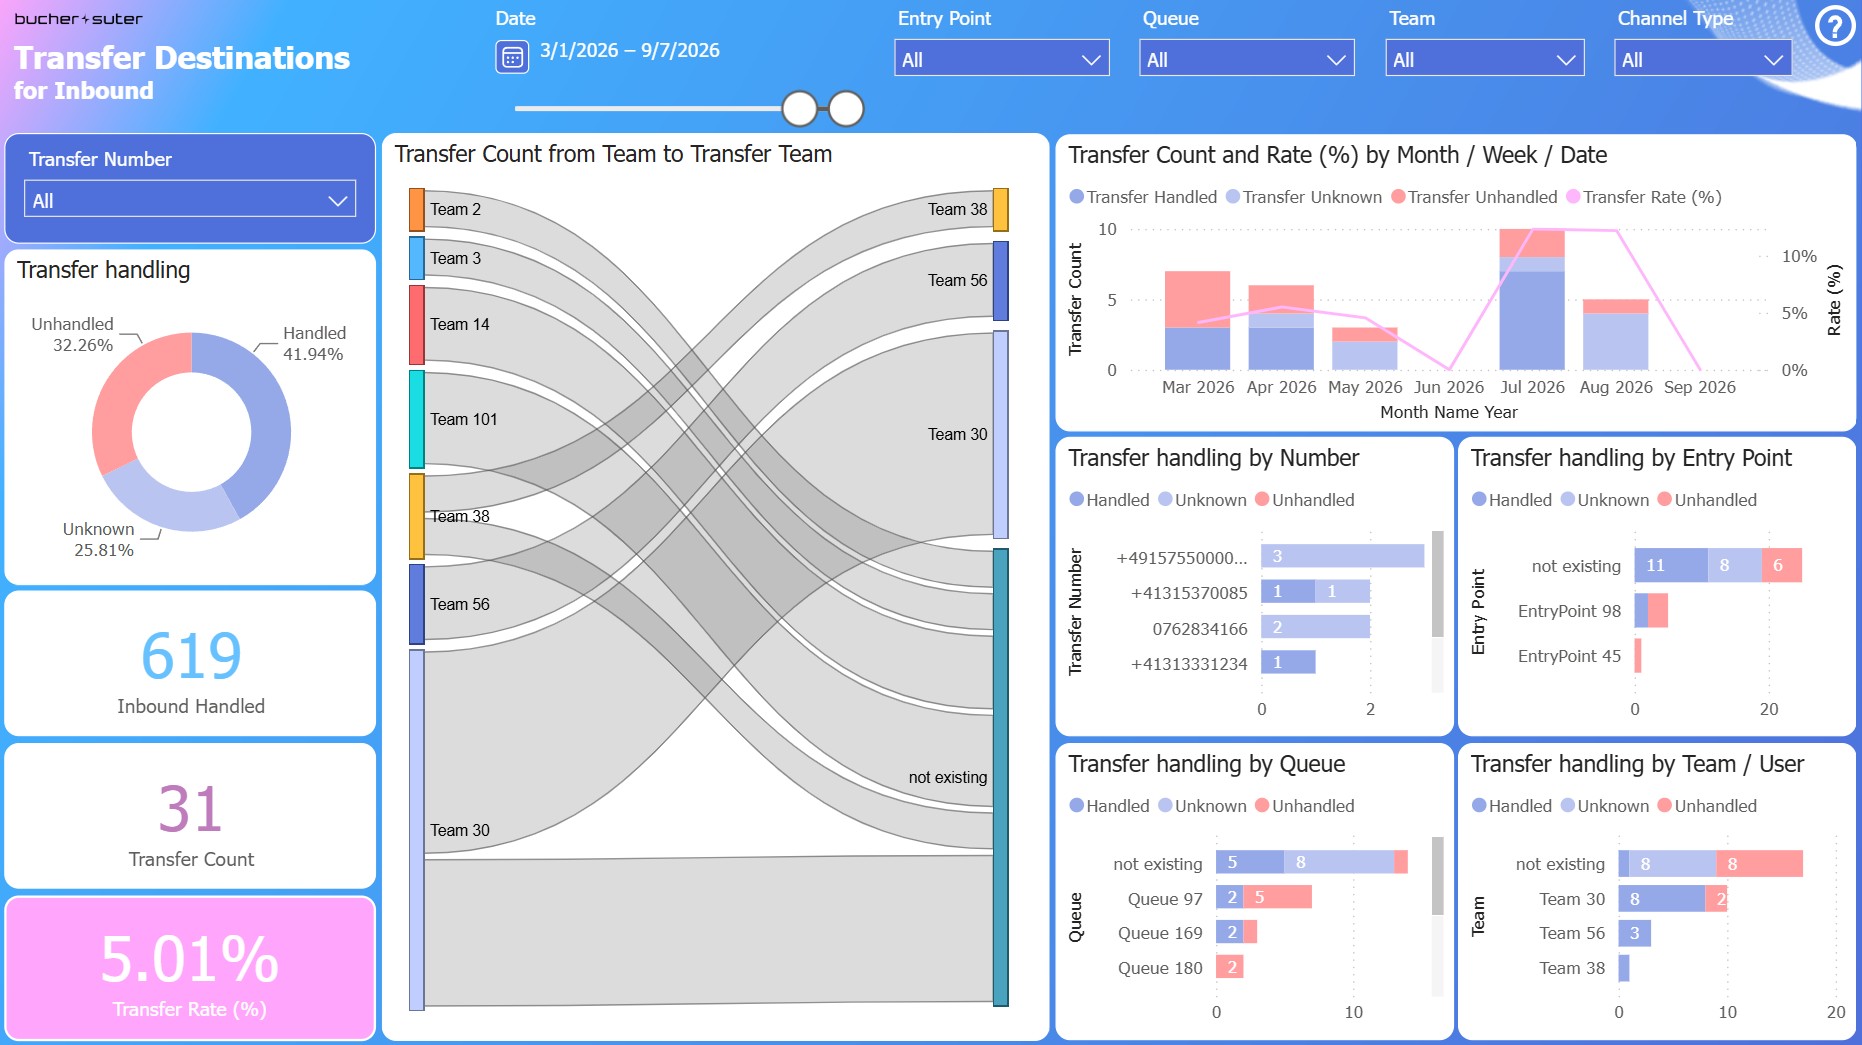
This report displays the transferred volume and rate (%) of inbound tasks to any destination. It also contains the outcome of the transfer handling for every specific target (unknown, if transfer leg does not exist or if transferred to a DN). Finally, it also displays the path from where to where the transfers went.
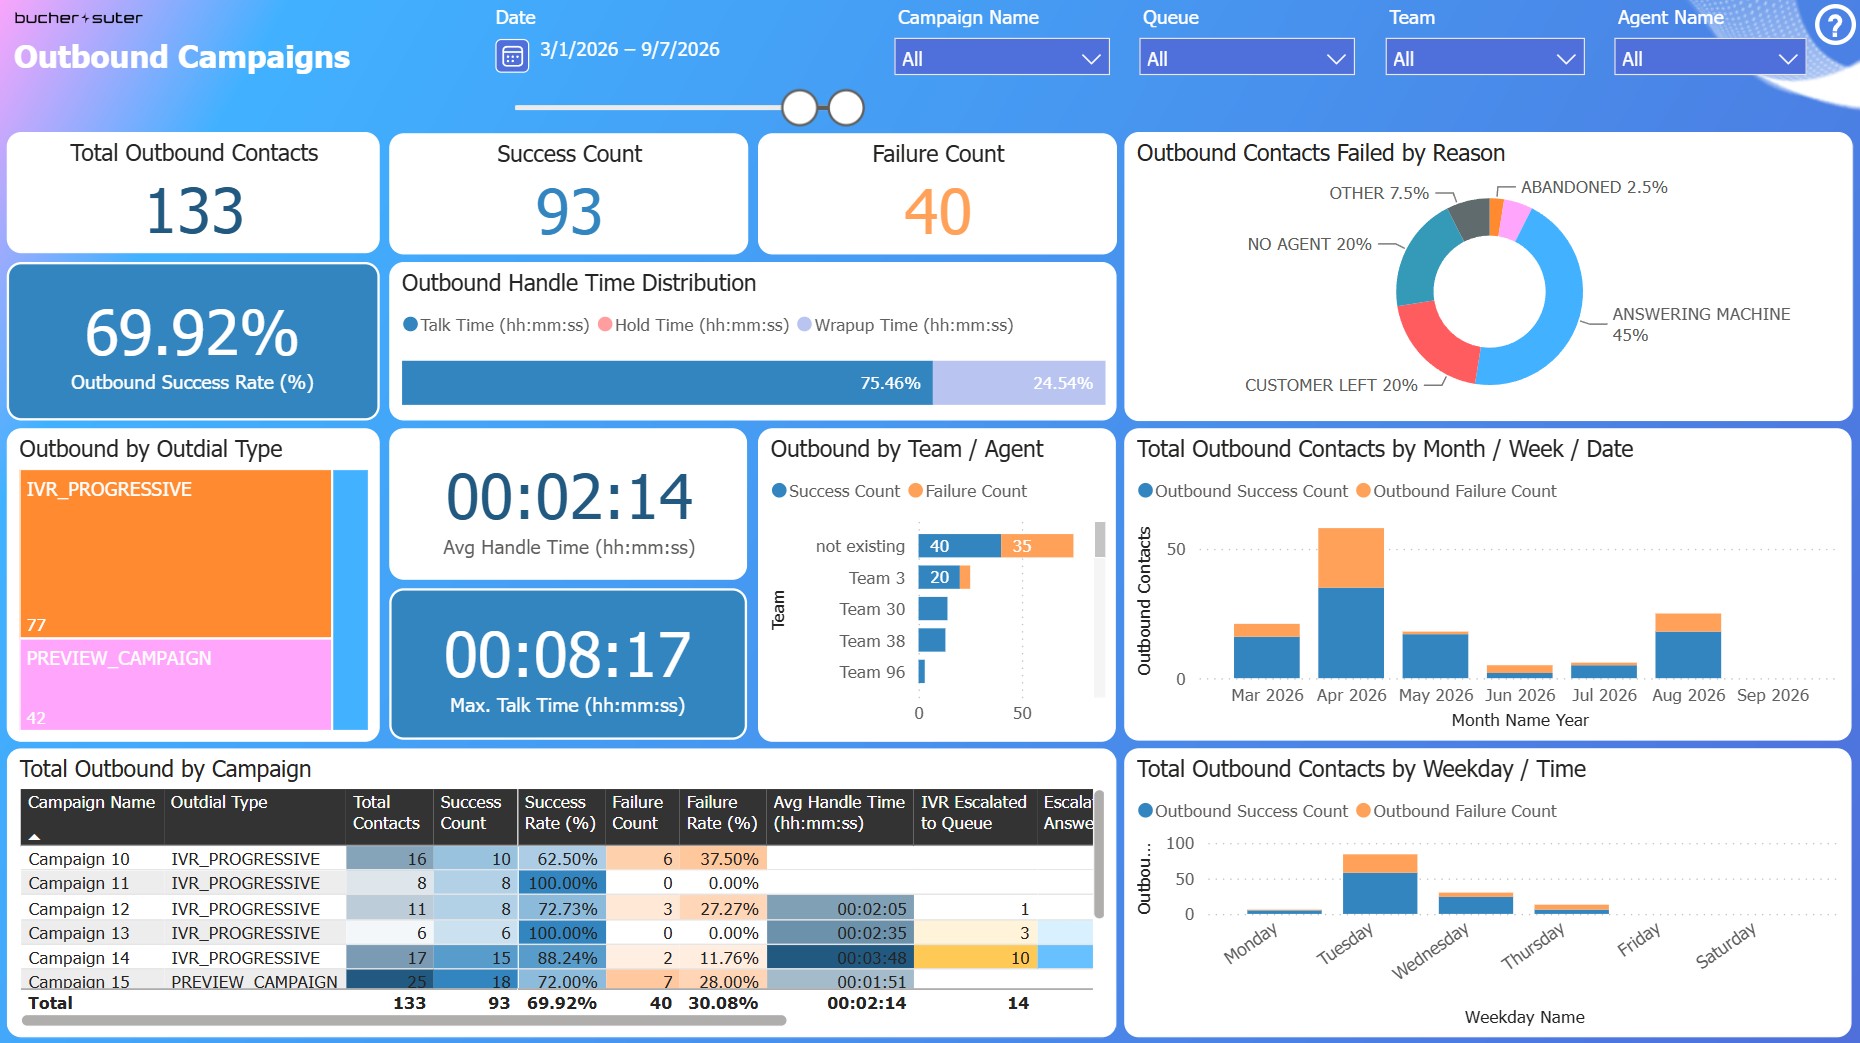
Outbound Campaigns
This report displays outbound calls related to a campaign where a dialler, the IVR or the agent in preview mode of a campaign is calling out. It shows the dialling modes, the result of the call progress analysis (CPA) and the call handling by the agents, including the escalated calls from IVR campaigns.
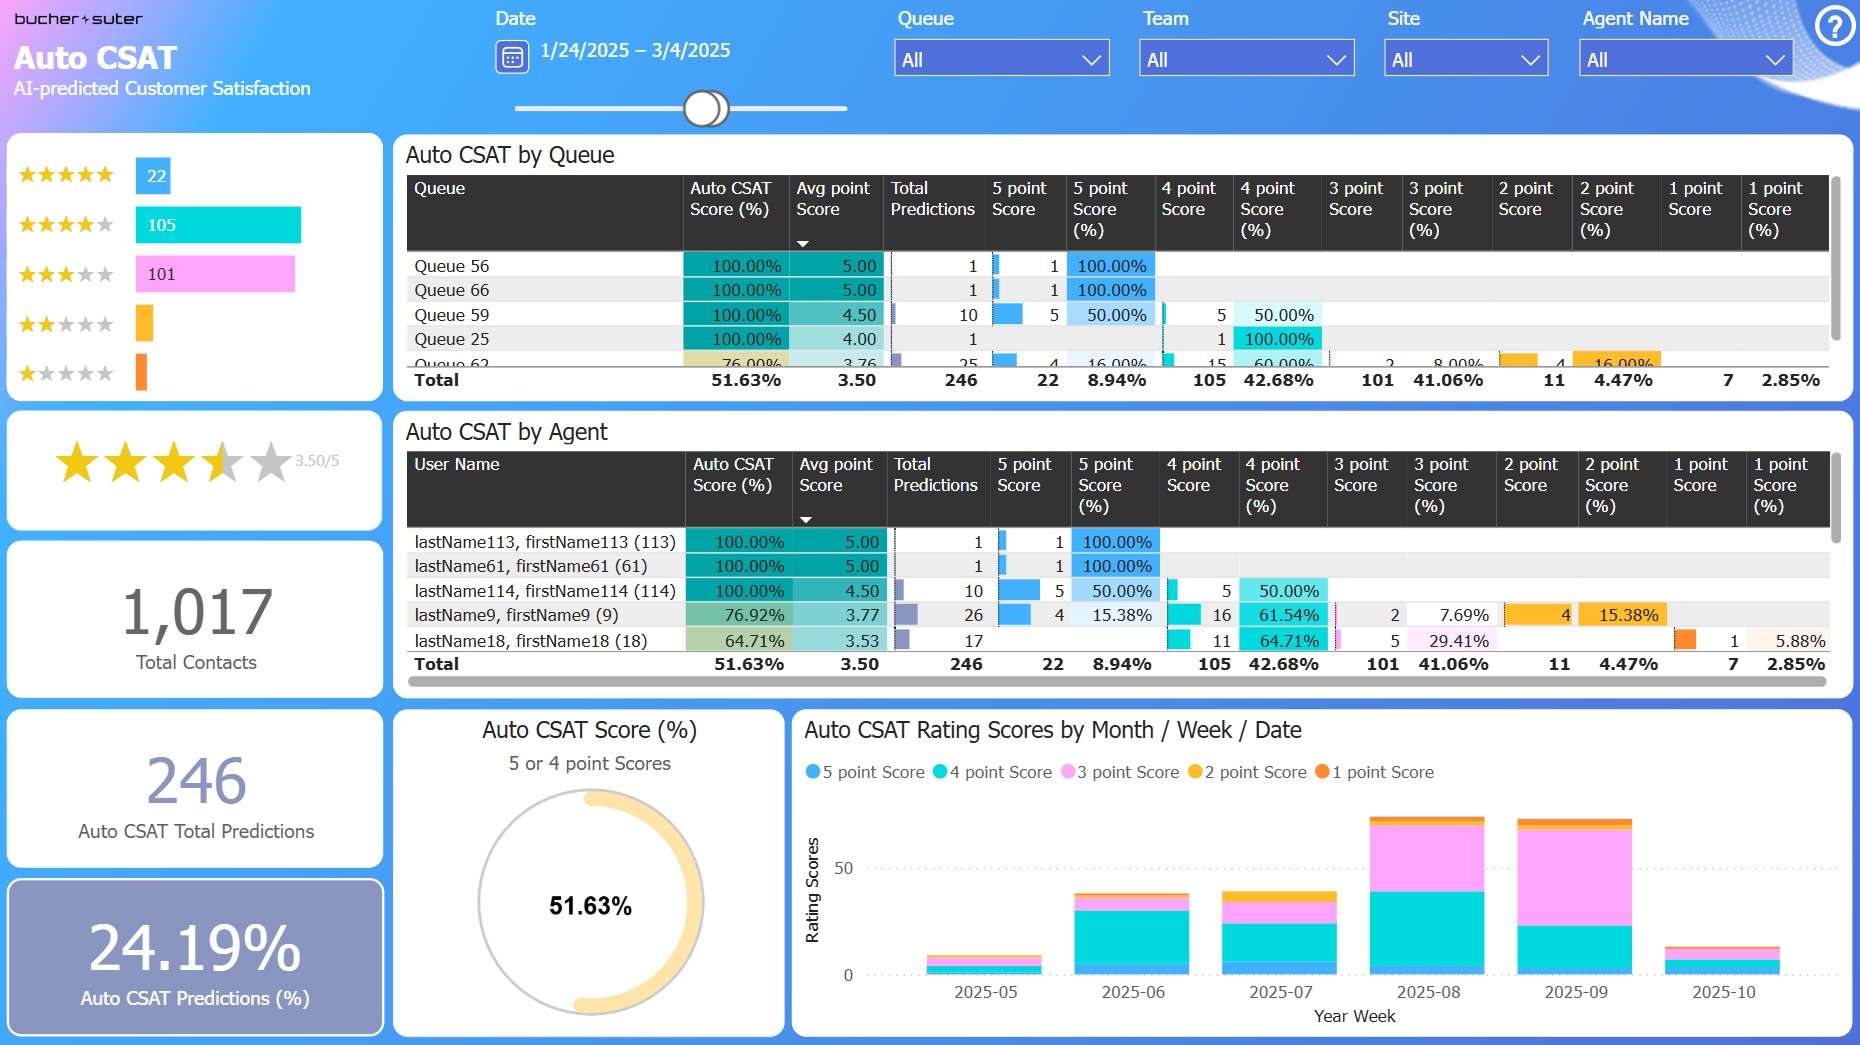
Auto CSAT
This report shows the AI-predicted customer satisfaction score from the Webex solution. It contains the counting of the 5 point CSAT scale.
Review the following article to see more details and how to enable the Auto CSAT feature: https://help.webex.com/en-us/article/l59wt8/Measure-customer-satisfaction-with-Auto-CSAT
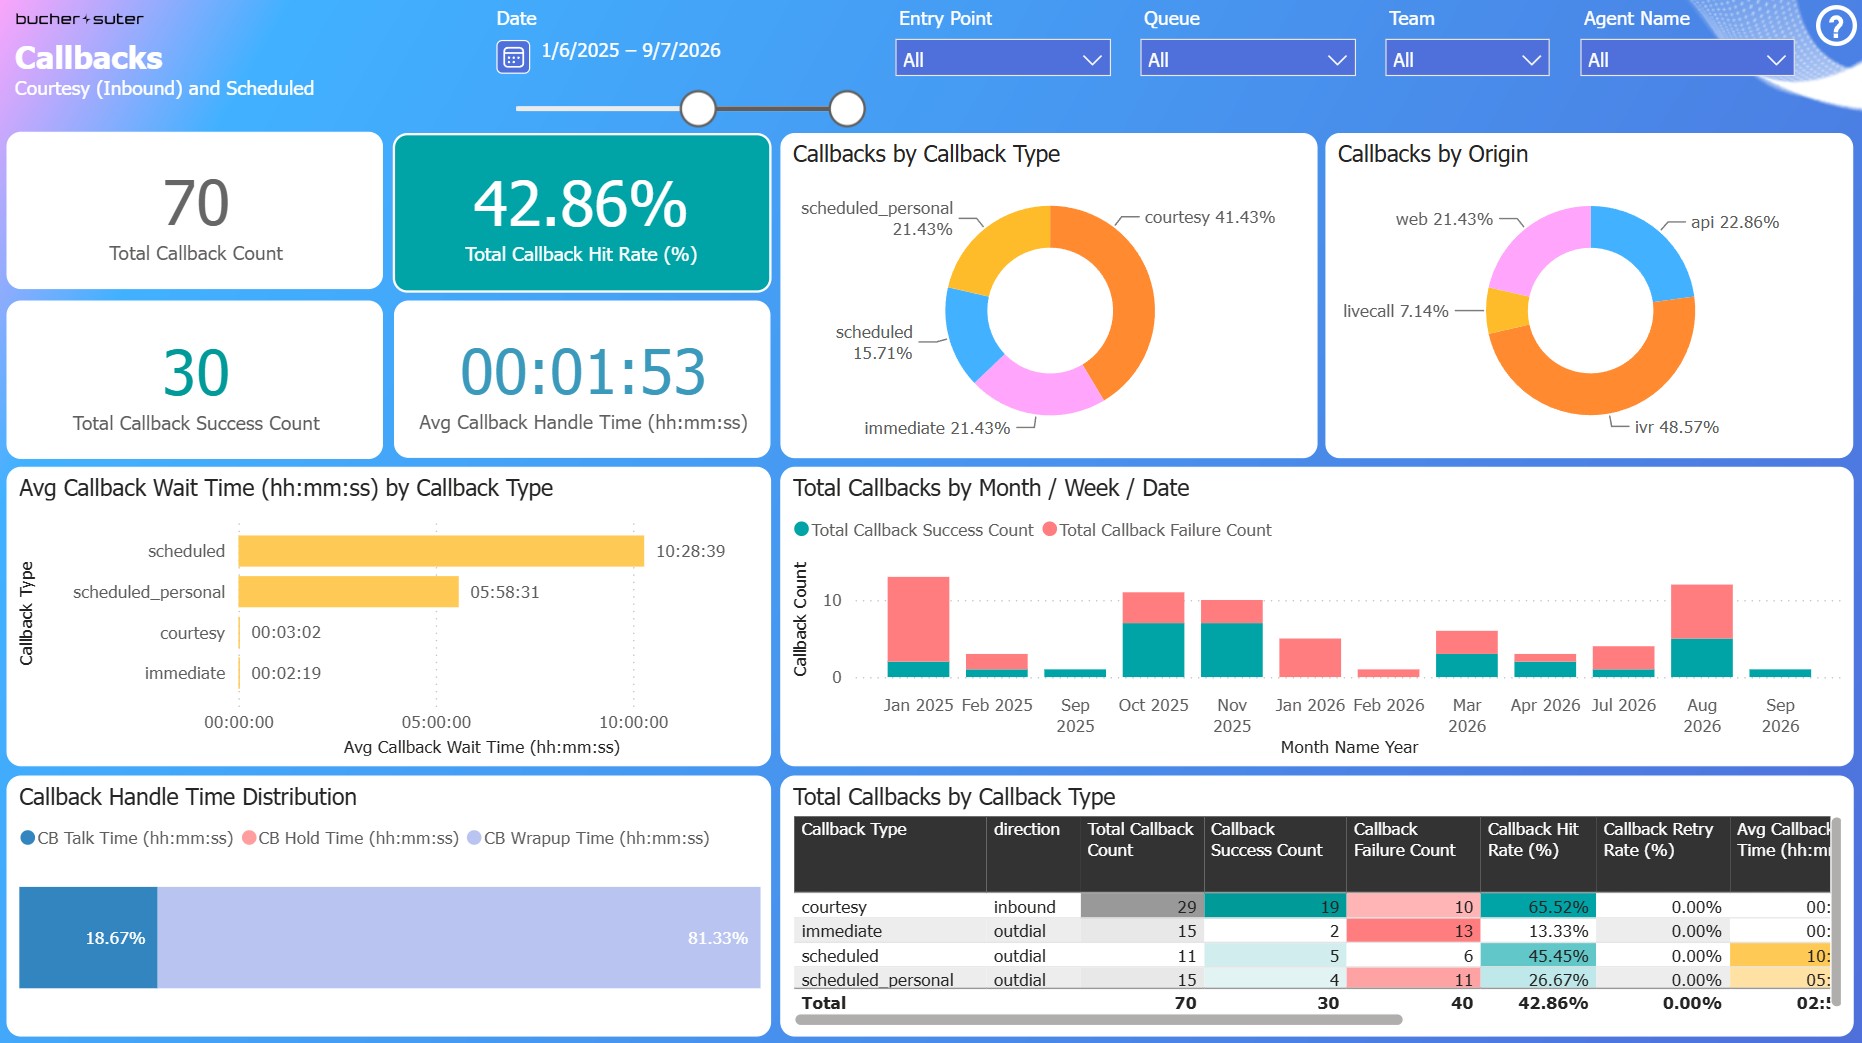
Callbacks
This report shows all callback calls that were requested by the customer waiting on an inbound call (courtesy) or that were executed immediately or scheduled at any time.
The callback wait time shows the duration from the callback request/schedule until the callback was successfully connected or failed.
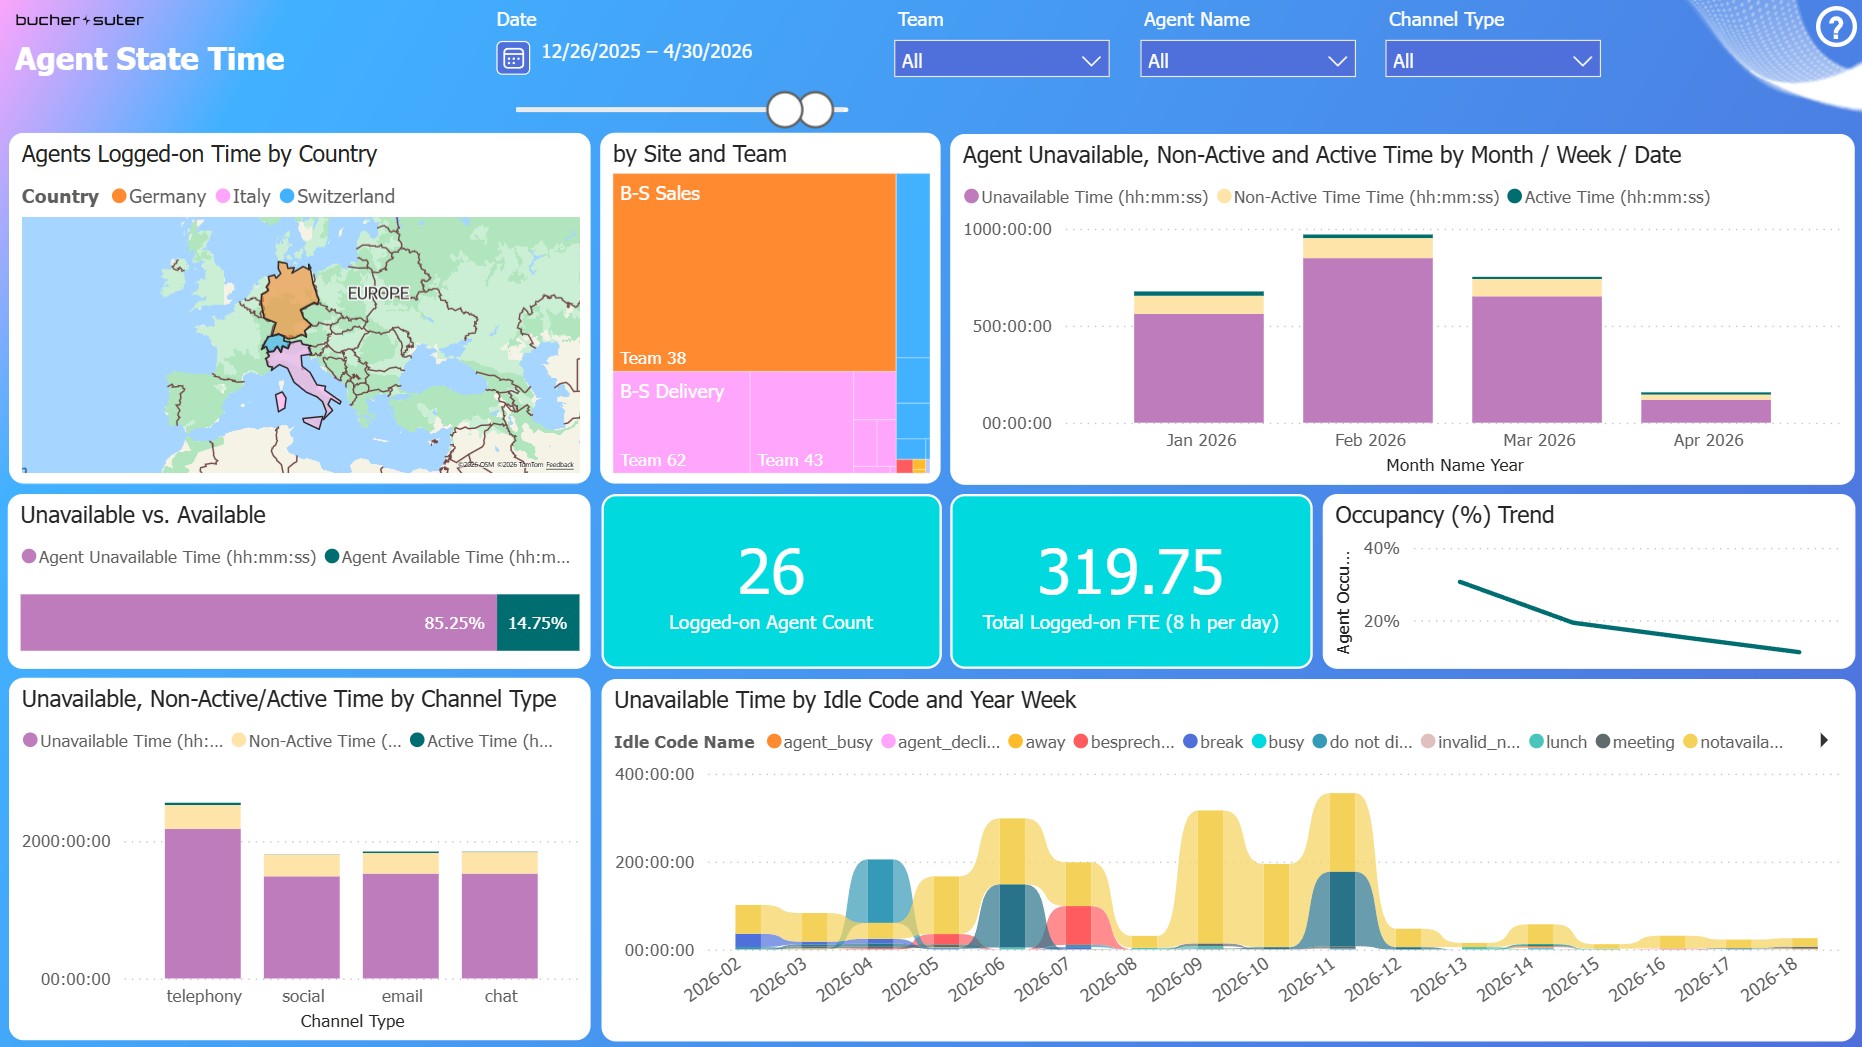
Agent State Time
This report gives you an overview about your available agents, their occupancy and activities during the idle stage.
Agent Overview
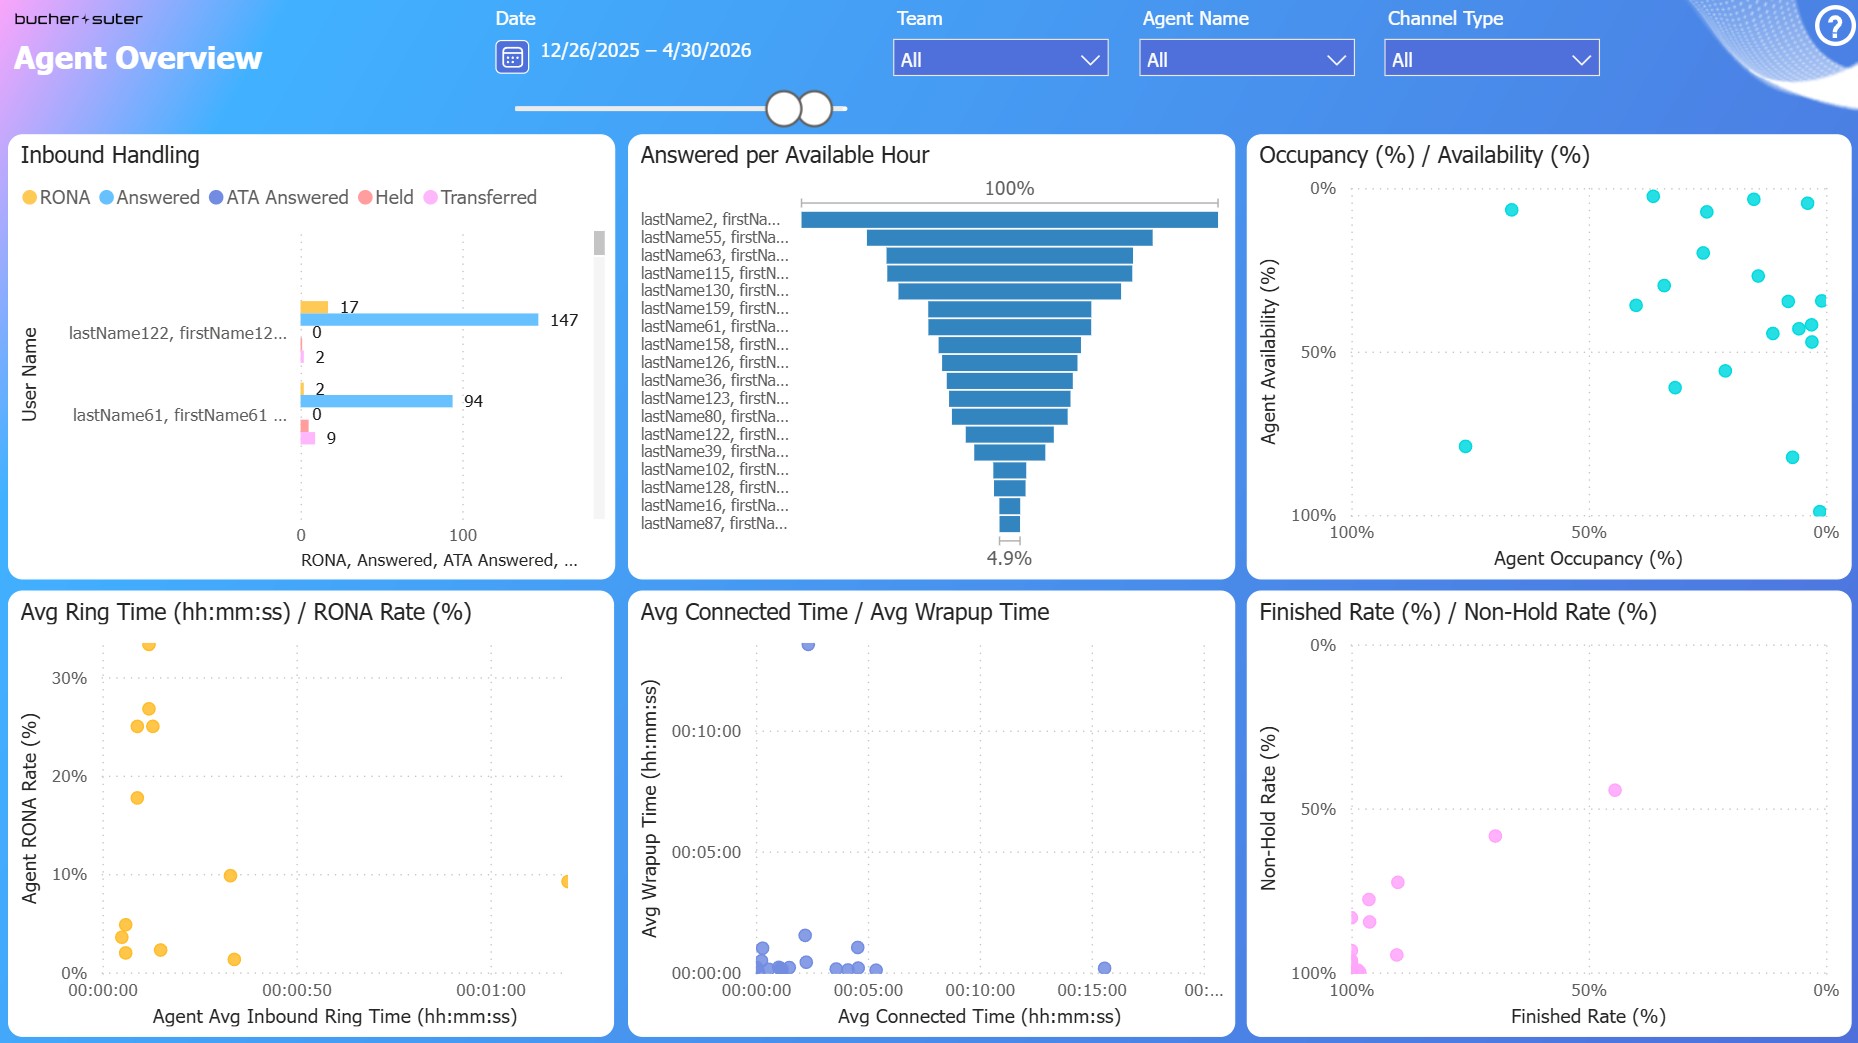
This report provides an overview about the agent KPIs and their distribution.