Tips & Tricks
This section contains useful Tips & Tricks to streamline the configuration process.
Working with lists
ServiceNow list views offer various features that help streamline configuration. For example: Contact Center records or Service Layouts can easily be assigned to multiple agents:
Step by step instructions:
- Login to ServiceNow Service Management as an administrator.
- Go to any list view.
- Hold down SHIFT + Mouse Left (the cursor will become a cross)
- Select fields to assign to a relevant record.
- Double-click the selected fields and assign the record.
- Click the green tick mark to commit the changes.
Working with related lists
Related lists help to identify which records are assigned to a given record. For example: related lists indicate which agents are assigned to a given Contact Center, while on the Contact Center form view.
The related list features the same capabilities as normal lists, but comes with a predefined filter. The following example shows how to delete all agents assigned to a given Contact Center record, using a related list.
Step by step instructions:
- Login to ServiceNow Service Management as an administrator.
- Go to any form view.
- Scroll to the bottom (the list displays records assigned to the list being viewed.)
- Select the records to delete.
- Open the
Selectmenu and clickDelete. - Confirm the action by clicking
Deletein the modal window.
Be careful! This action does not delete the relation, it deletes the actual record!
Using list views to generate query strings
b+s Connects for ServiceNow's data lookup features (participant lookup / directory lookup) are designed to be compatible with ServiceNow's powerful query system, which is available as a URL query or a filter query.
This means that default ServiceNow list views can be used to generate b+s Connects for ServiceNow compatible configurations.
Step by step instructions:
- Login to ServiceNow Service Management as an administrator.
- Go to any list view.
- Show the filter and define the query to your liking.
- Run the filter. Please note: when using b+s Connects for ServiceNow placeholders, the list will most likely not display any records.
- Right click the filter string, and click "Copy query" in the context menu
- Navigate to the b+s Connects for ServiceNow configuration record you would like to change.
- Paste the query string from the clipboard to the query string field.
- Save your changes.
Create a copy of a ServiceNow form
The following video shows how to create a copy of an existing Service Layout.
Creating reports with ServiceNow Dashboard
The following example shows how data from b+s Connects can be displayed in ServiceNow. To visualize the data, a dashboard must first be created and then single cell widgets can be inserted into the dashboard. Any data can be visualized using widgets.
The following example shows how to display all work items sorted by weekday.
Dashboard
A new dashboard is created as follows:
- Login to ServiceNow Service Management as an administrator.
- Go to
Self-Serviceby searching in the left panel and navigate toDashboards. Then clickNewto create a record. - Enter a name, group, order, roles to restrict to and owner to help identify the Dashboard being configured.
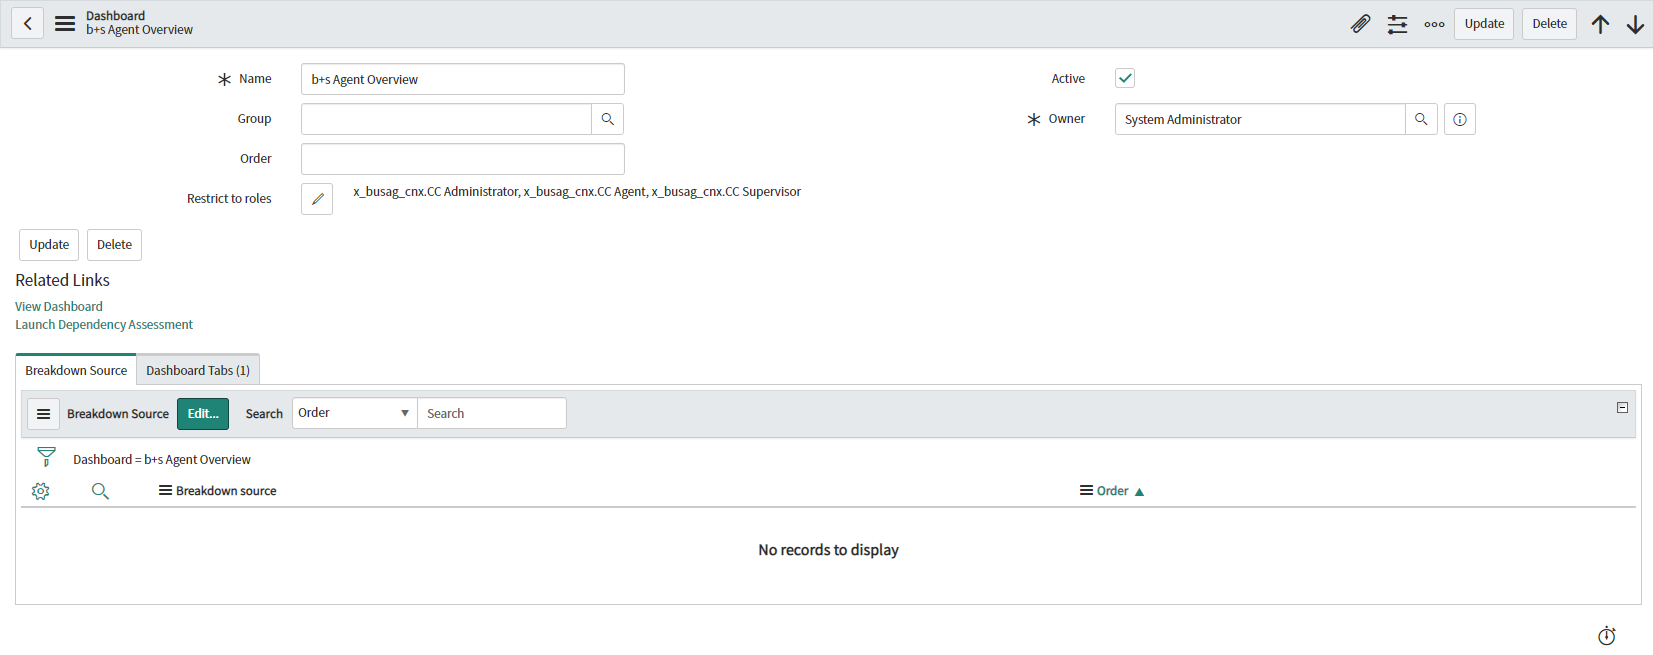
- Click
Submitto save the configuration. - The dashboard is created with no content. To add content in the right panel
Add Widgets, select a widget type and a widget and click Add. Quickly find and preview widgets, then add them to the dashboard from the Add Widget pane.
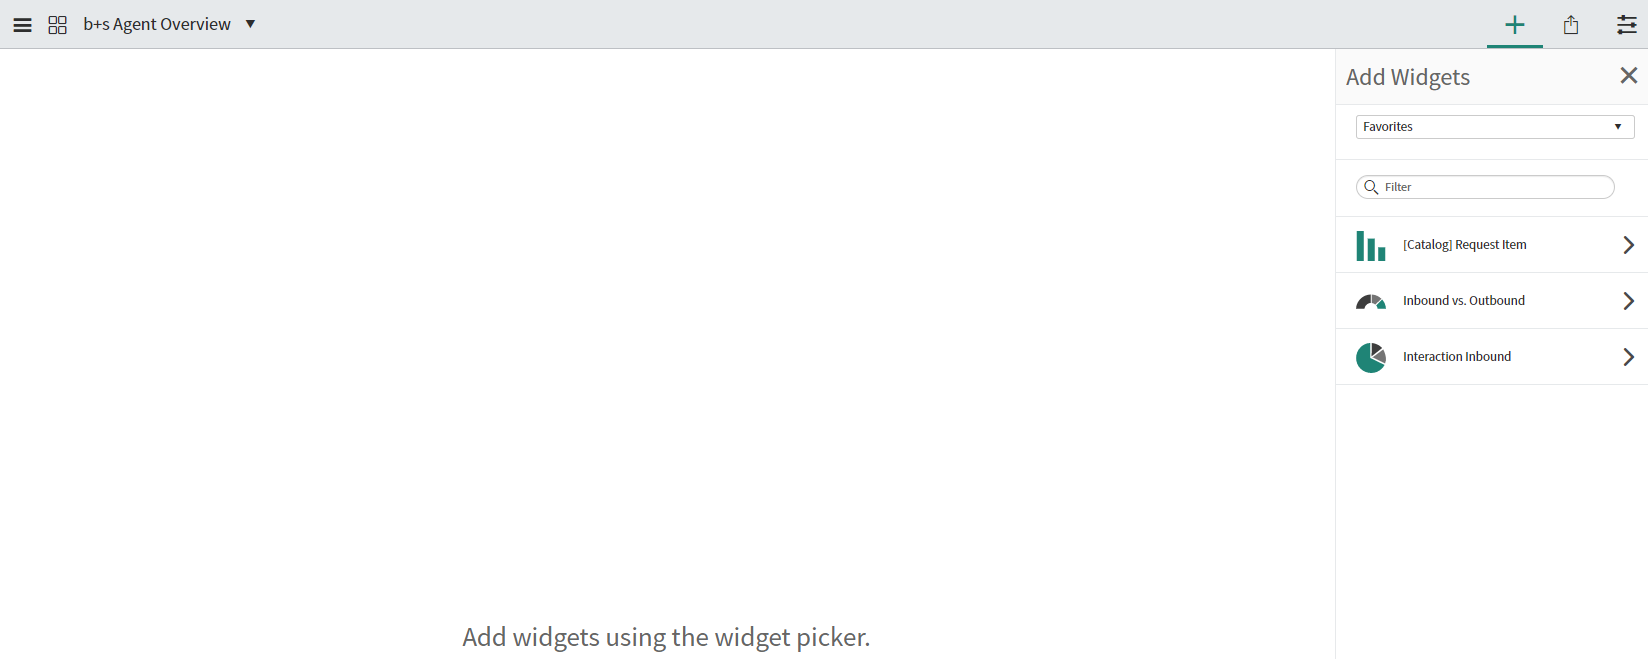
Easily share dashboards with other users from the integrated sharing pane. Set dashboards as your home. You can set dashboards instead of homepages as your home. With this setting, the last dashboard you selected appears when you navigate to Self-Service > Homepage, or click the logo on the upper left corner.
Dashboard widget
Responsive dashboards enable users to share widgets such as reports and Performance Analytics visualizations. Create and edit Performance Analytics reports and other widgets directly from the dashboard.
A new widget is created as follows:
In the right panel Add Widgets, select a widget type Reports and create New Report and click Add.
Set a suitable name like
Total calls by day. As source type you can select table or data source. In this example,tableis selected. If table is selected it is possible to access all ServiceNow and customer tables as the source. The information how many calls have been made can be found in the custom tableWork Logfor this reason this table is selected.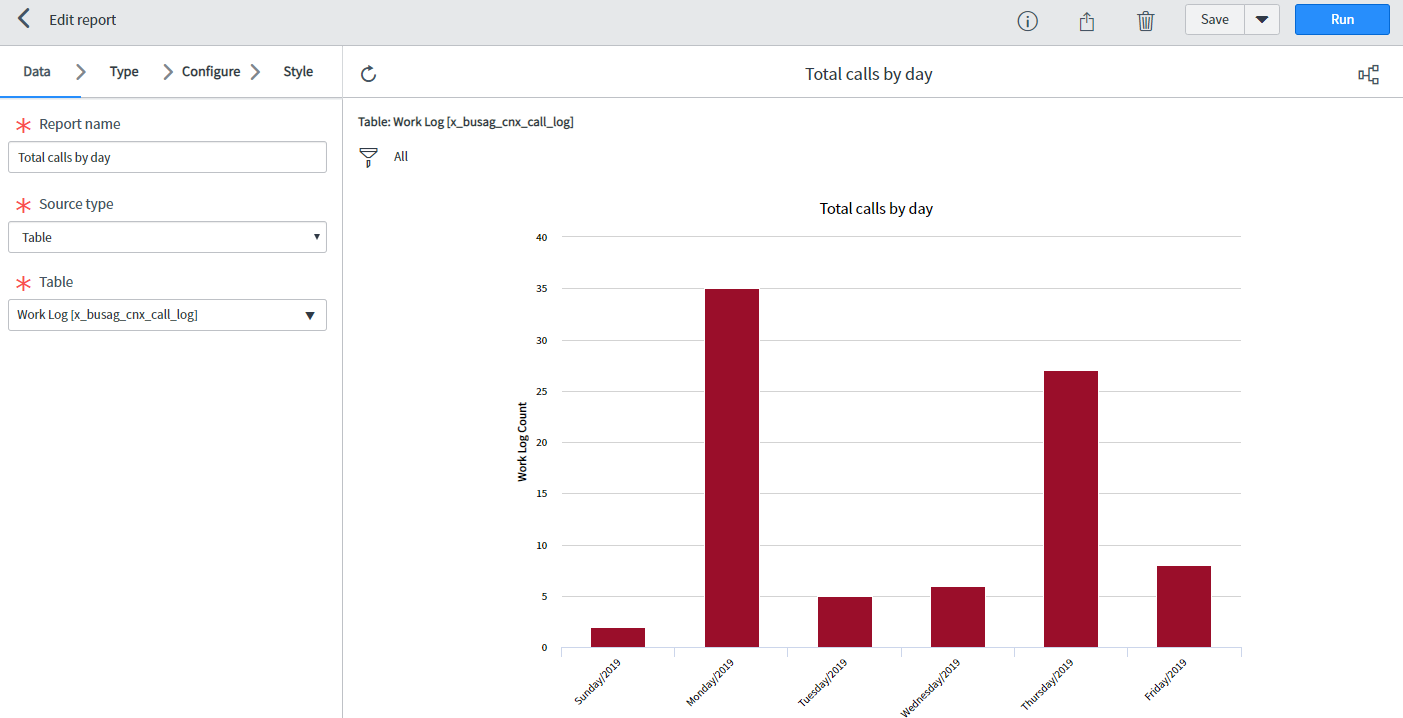
In the next step you can select the diagram type like bars, pies, donuts or time series. Selecting a diagram type has an effect on the following steps. In order to display the calls for the respective weekday, the best diagram type for this use case is a time series like
Column.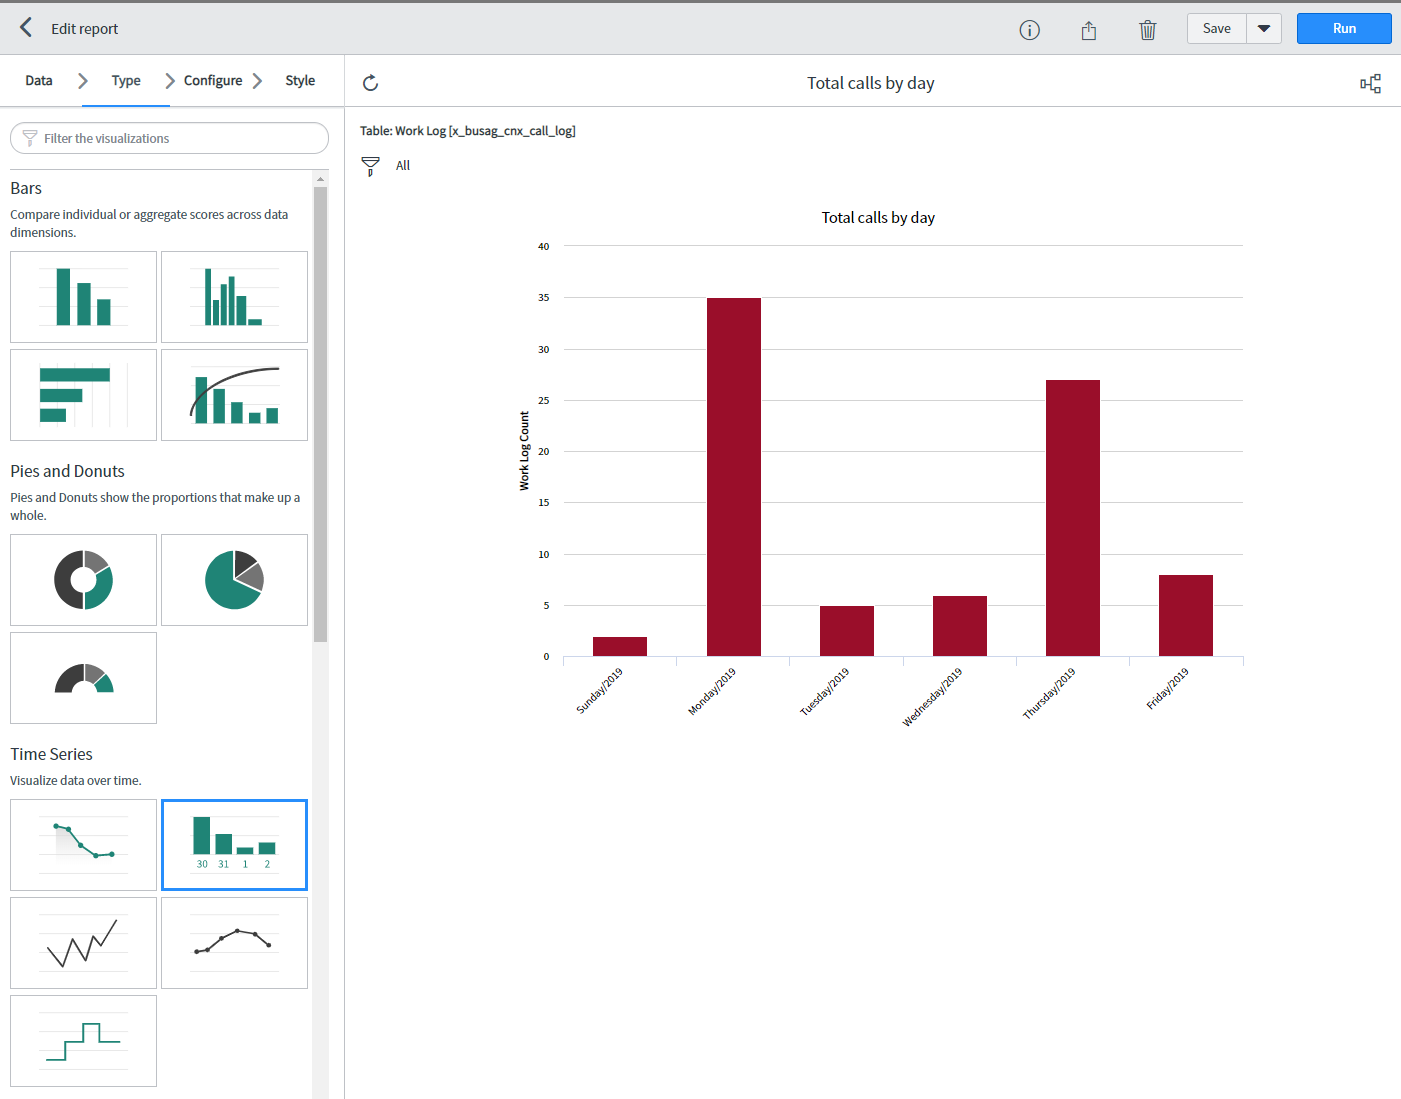
Under configuration it is possible to display the data of only one specific group. The data will be displayed as
Trend by Create per Day.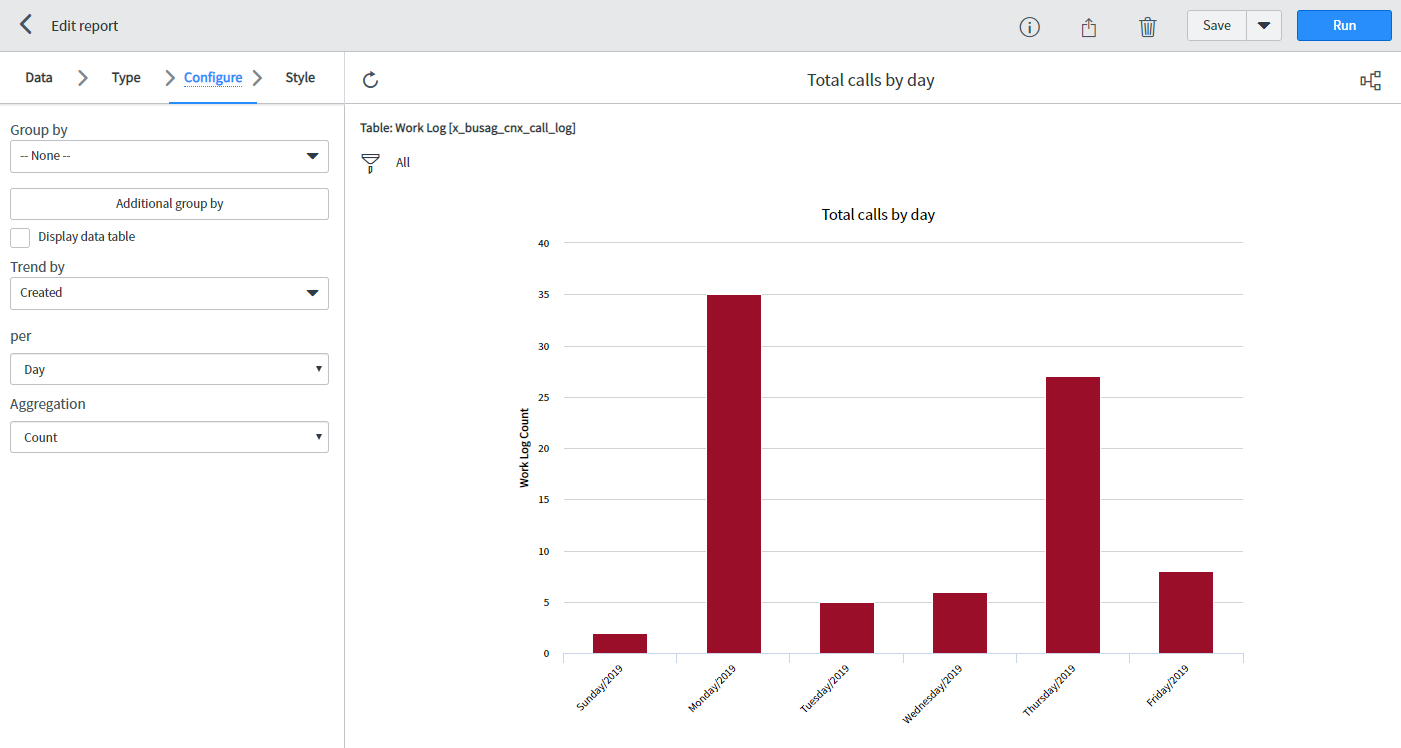
The style tab allows you to stylize the statistics according to your desired display color, size of the font or axis labeling.
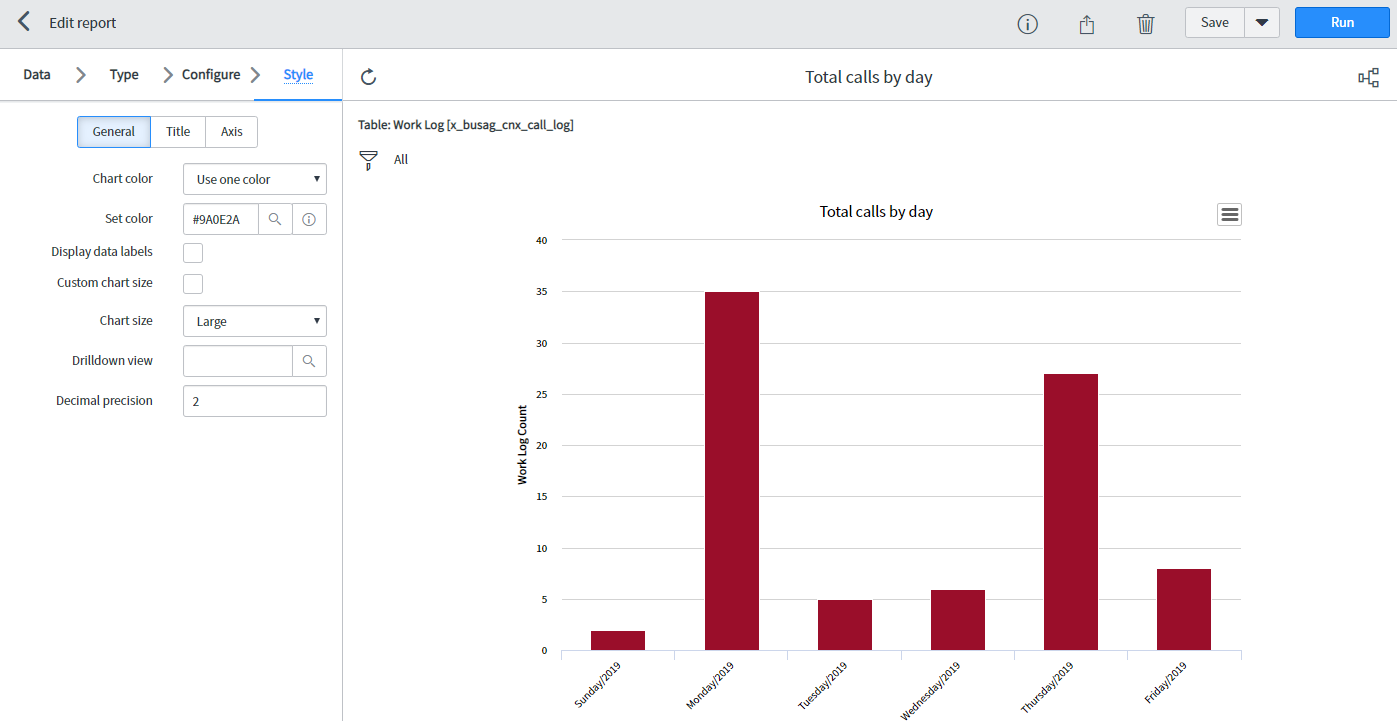
Using the
Runbutton you can simulate the widget according to your configuration and test if it displays what you expect.Save Widget. After creating the widget you can display and place it on the dashboard.
With the
sharing buttonin the upper right corner you can define which group or which user is allowed to see this widget.