b+s Connects Dashboards
Introduction
The b+s Connects Dashboards package includes a number of Salesforce Dashboards developed by b+s and distributed through an unmanaged package.
This document provides information about the installation of the b+s Connects Dashboards package and the configuration of its components.
The b+s Connects Dashboards requires the b+s Connects for Salesforce package to be pre-installed in the Salesforce org.
THE SOFTWARE IS PROVIDED "AS IS", WITHOUT WARRANTY OF ANY KIND, EXPRESS OR IMPLIED, INCLUDING BUT NOT LIMITED TO THE WARRANTIES OF MERCHANTABILITY, FITNESS FOR A PARTICULAR PURPOSE AND NONINFRINGEMENT. IN NO EVENT SHALL THE AUTHORS OR COPYRIGHT HOLDERS BE LIABLE FOR ANY CLAIM, DAMAGES OR OTHER LIABILITY, WHETHER IN AN ACTION OF CONTRACT, TORT OR OTHERWISE, ARISING FROM, OUT OF OR IN CONNECTION WITH THE SOFTWARE OR THE USE OR OTHER DEALINGS IN THE SOFTWARE.
The package is distributed as a Salesforce unmanaged package, which contains the following components:
Dynamic Dashboards (contained in the b+s Connects for Salesforce Dashboards Dashboard Folder)
Contact Center - Agent DashboardContact Center - Supervisor Dashboard
Reports (contained in the b+s Connects for Salesforce Reports Report Folder)
Calls by Agent last 30 daysCalls by Day last 30 daysMy Calls by Day last 30 daysCalls TodayMy Calls Today
Once the package is installed, all aforementioned components will be fully accessible and editable.
Installation
b+s Connects Dashboards v1.0
Open in a browser: https://login.salesforce.com/packaging/installPackage.apexp?p0=04t090000007BRi
Login into Salesforce using the username of the Org where the b+s Connects Dashboard package will be installed
Follow the instructions on screen and click on the
InstallbuttonOnce the package is installed, all its components are immediately accessible and editable.
Configuration
Adjust your desired Access Levels for Report and Dashboard Folders before rolling out the new components to your Users. Follow the Salesforce official docs for an exhaustive guide through Dashboards and Reports permissions and management.
Salesforce Classic
- On the objects navbar, click on
+button - Click on
Reports - Use the Folders list to search for
b+s Connects for Salesforce Dashboards, click on it - Click on the desired Dashboard to open it in view mode
Depending on a number of factors, it may not be possible to edit the dynamic dashboards in Salesforce Classic. It is highly recommended switching to Salesforce Lightning Experience in order to edit the b+s Connects Dashboards.
Salesforce Lightning Experience
- Click on the 9-dots button
- Use the search bar to search for
Dashboardsor click onView All, then onDashboards
Dashboards and reports can be shared with a specific User or Public Group:
- In the Folders list, click on the Folder to share
- Click on the down arrow button in the buttons group on the right side of the window
- Click on
Share - Assign or change existing permissions to View/Edit/Manage to specific Users or Public Groups as needed
Additional information can be found in the official documentation.
All Users of a specific Profile can be granted view access to all dashboards present in Public Folders by enabling
the View Dashboards in Public Folders and View Reports in Public Folders settings in the Profile.
In order to make the Dashboards and their Reports visible to Users or Public Groups, make sure that both Dashboard and Report Folders are shared with the required permissions. Sharing Folders to specific Users or Public Groups overrides the Profile settings described in the note above.
Agent Dashboard
Use "Agent Dashboard" for a bird’s eye view of your personal performance.
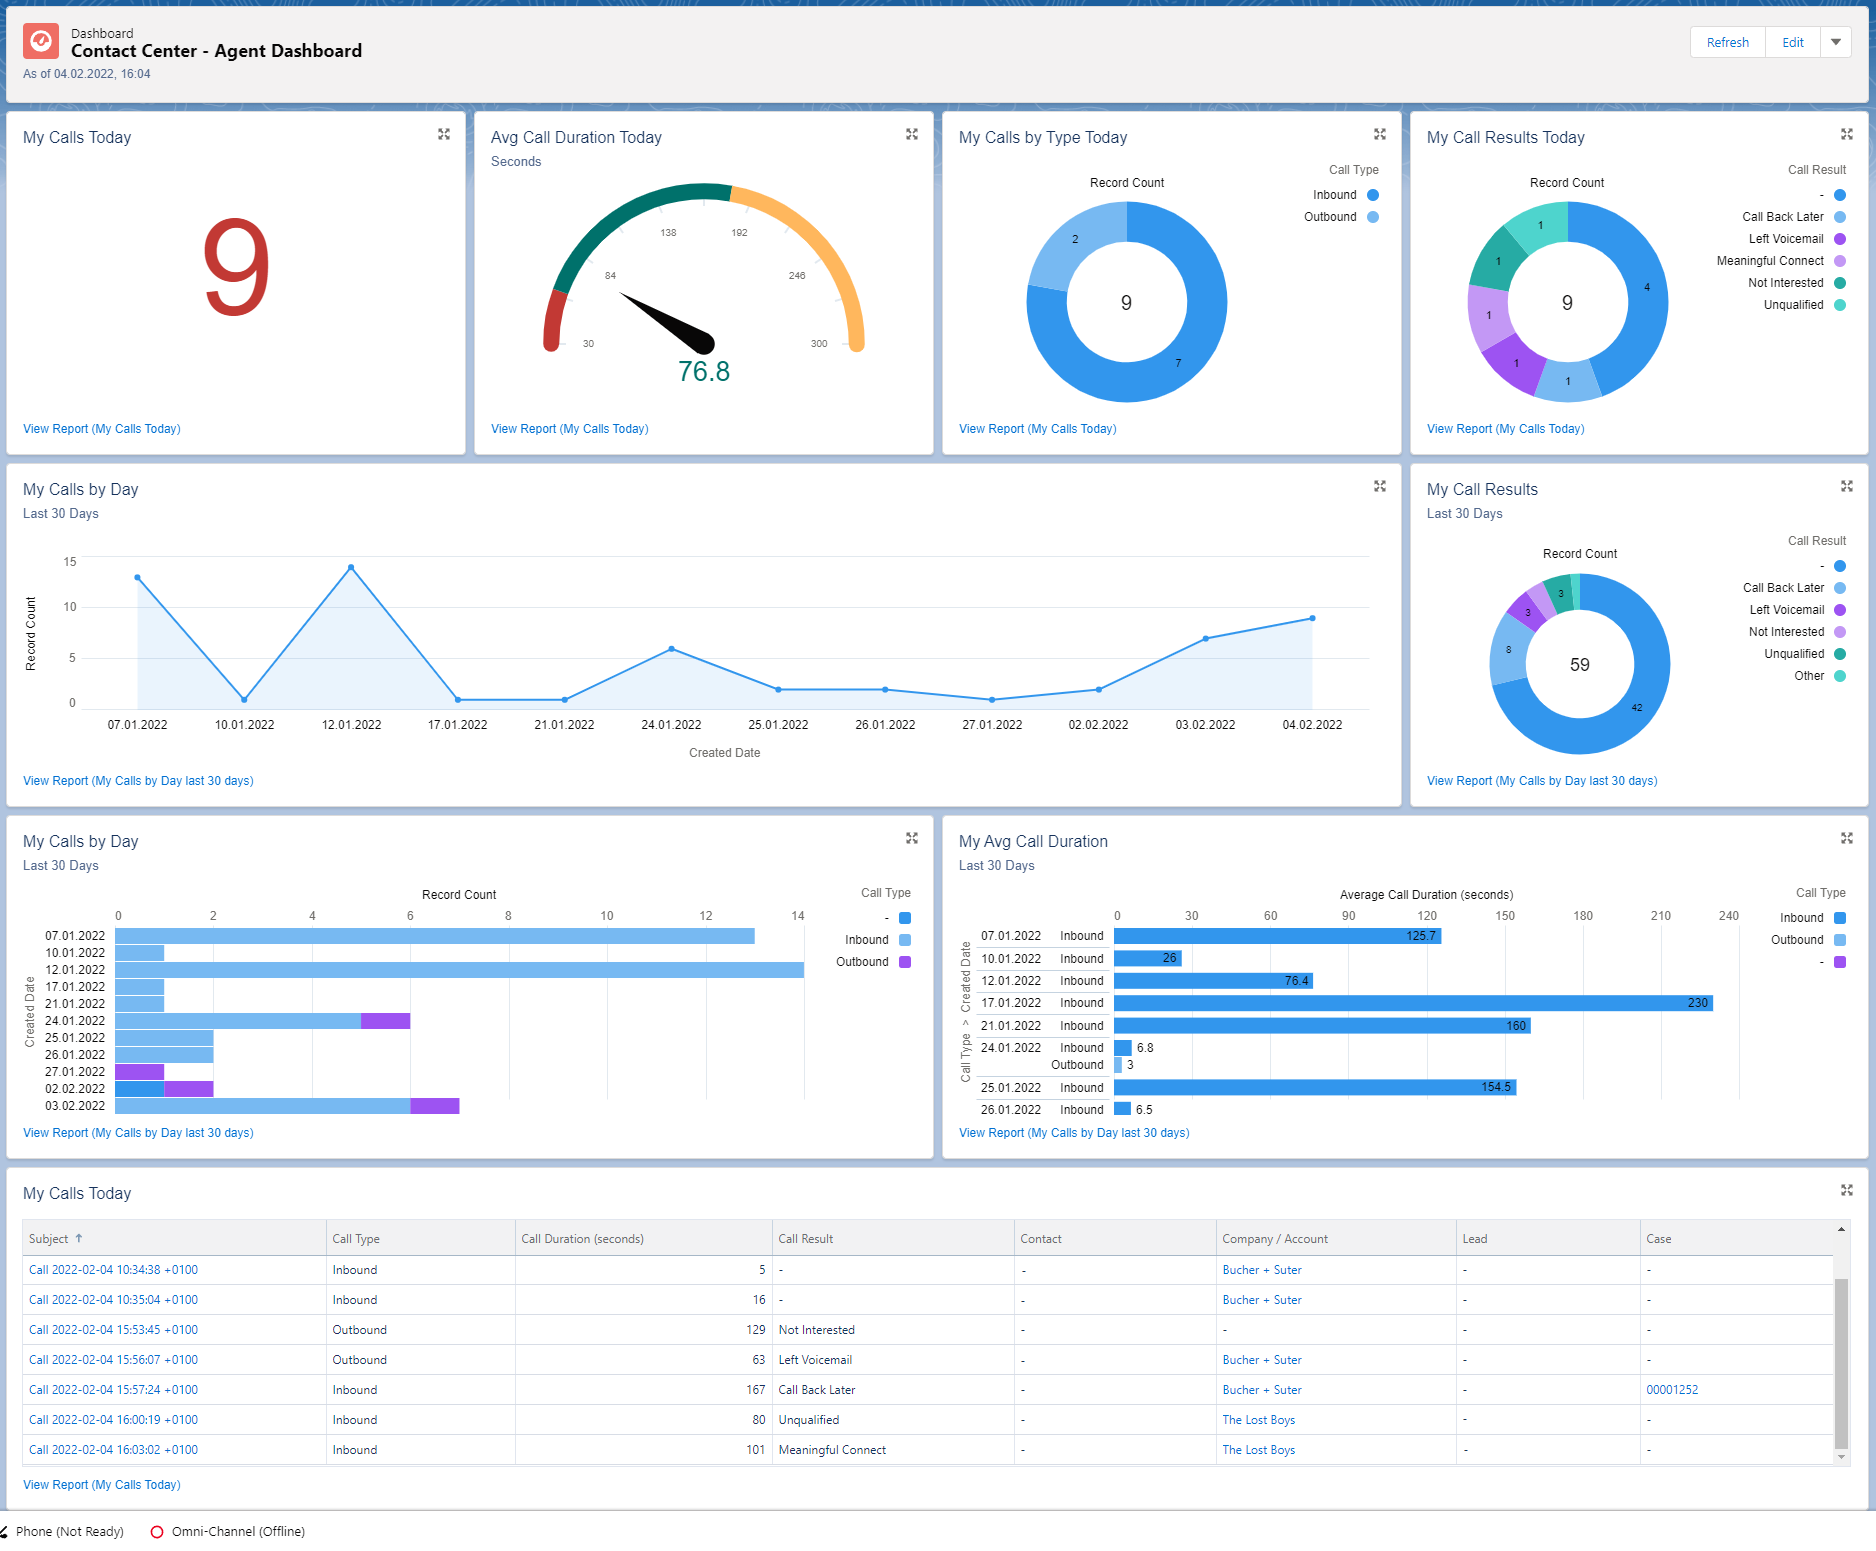
What information does this dashboard provide?
- How is my performance today?
- Calls today
- Total answered calls
- Average call duration
- Calls by type (in/out)
- Call results (Wrap-Up reasons)
- List of calls answered
- Calls last 30 days
- Record count per day
- Total calls answered
- Call type per day (in/out)
- Average call duration per day
Supervisor Dashboard
Use "Supervisor Dashboard" for a bird’s eye view of the call center performance.
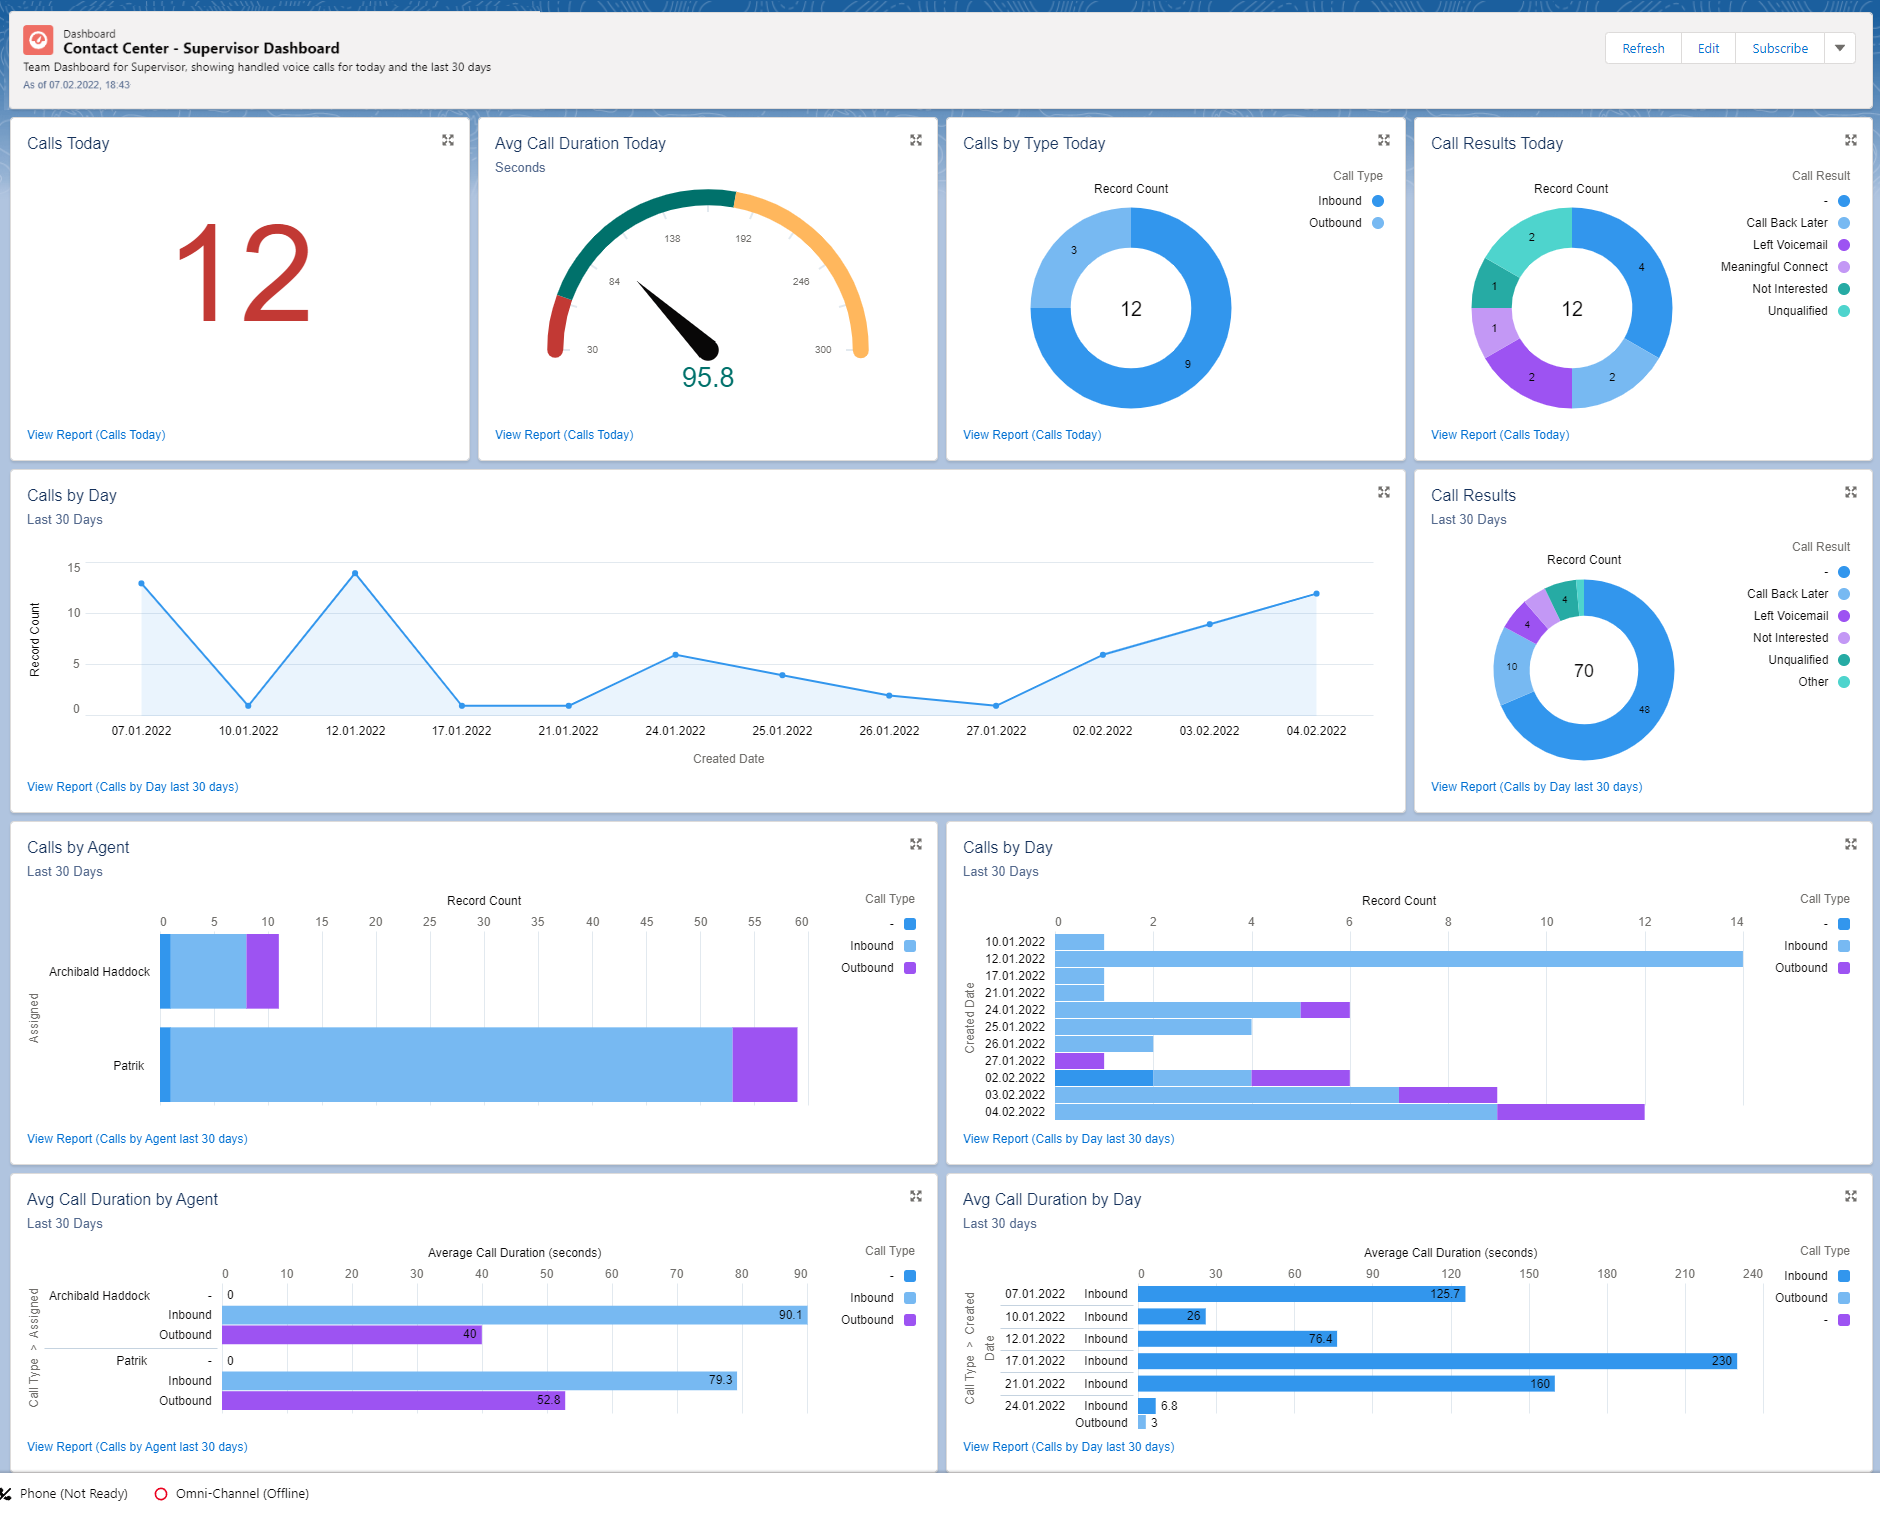
What information does this dashboard provide?
- How is the total performance today?
- Global Calls today
- Total answered calls
- Average call duration
- Calls by type (in/out)
- Call results (Wrap-Up reasons)
- Global Calls last 30 days
- Record count per day
- Total calls answered
- Call type per day (in/out)
- Average call duration per day