Team Leader
This report contains the following pages:
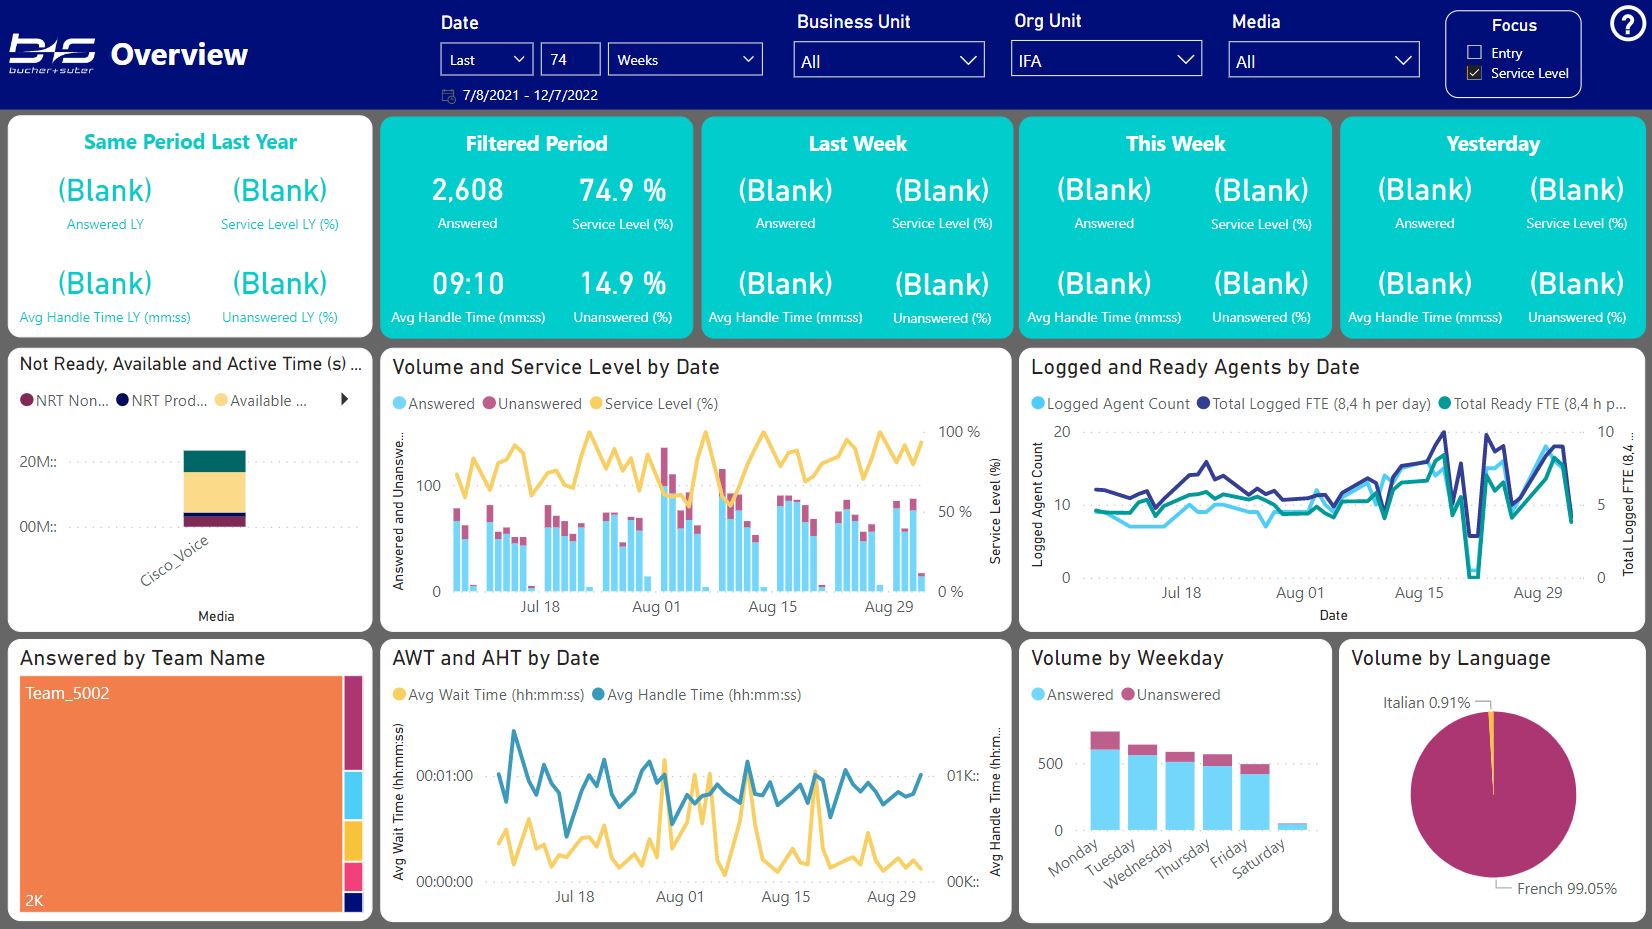
Overview
This report gives you an overview about a certain area within your Contact Center for a shorter period.
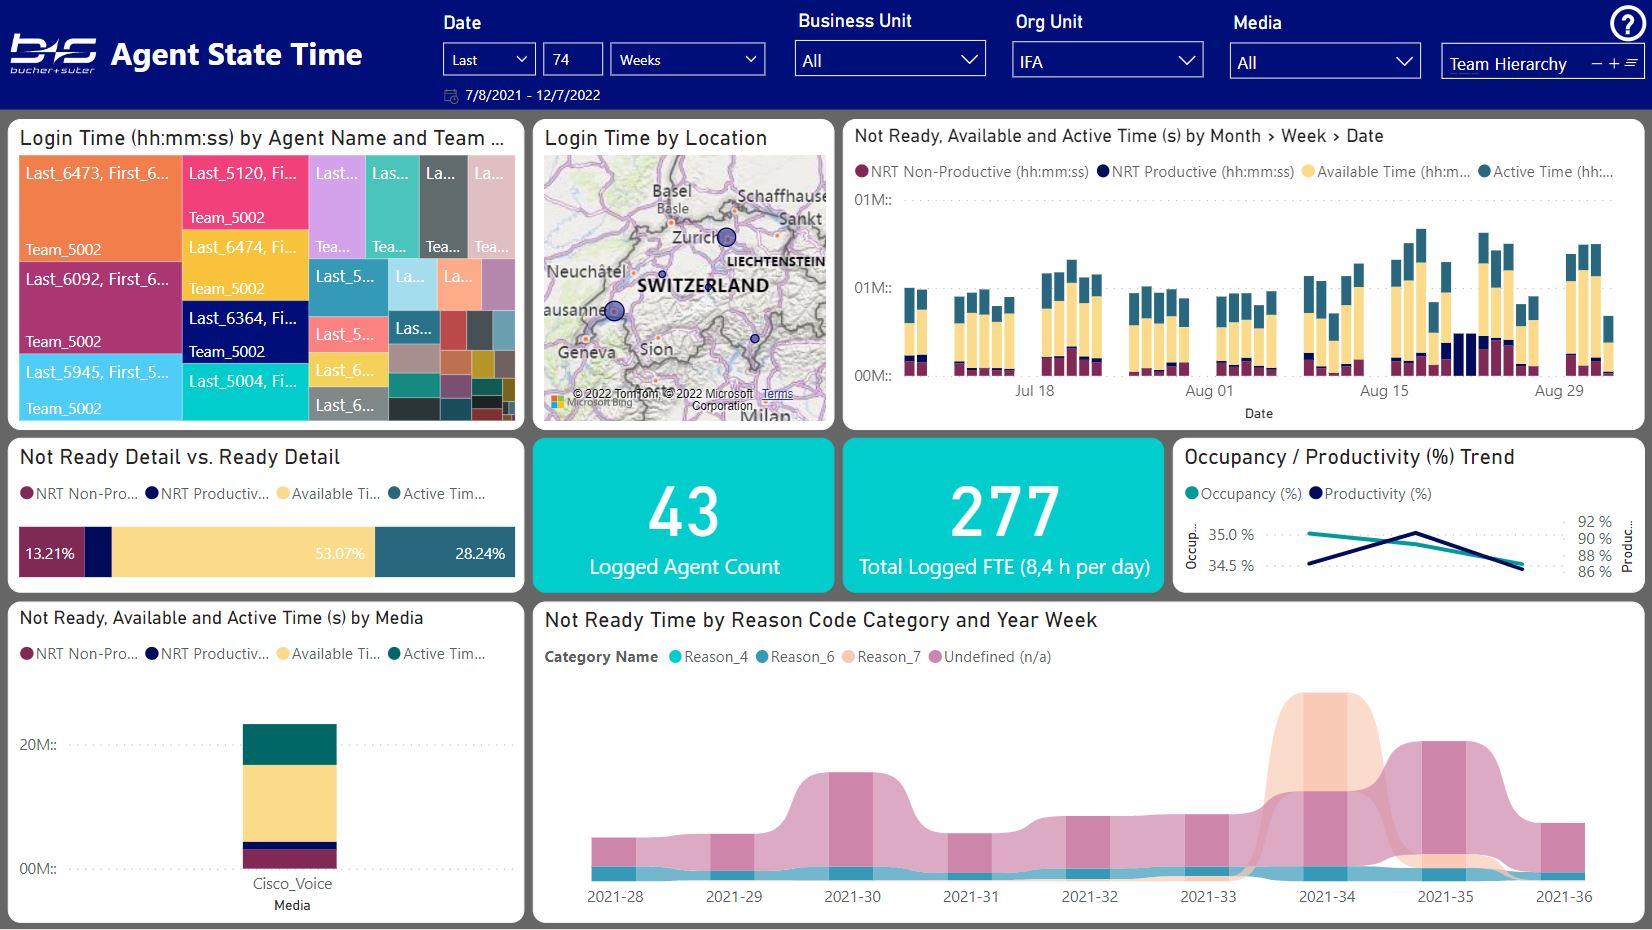
Agent States
This report gives you an overview about your available agents, their occupancy and activities during the not ready stage.
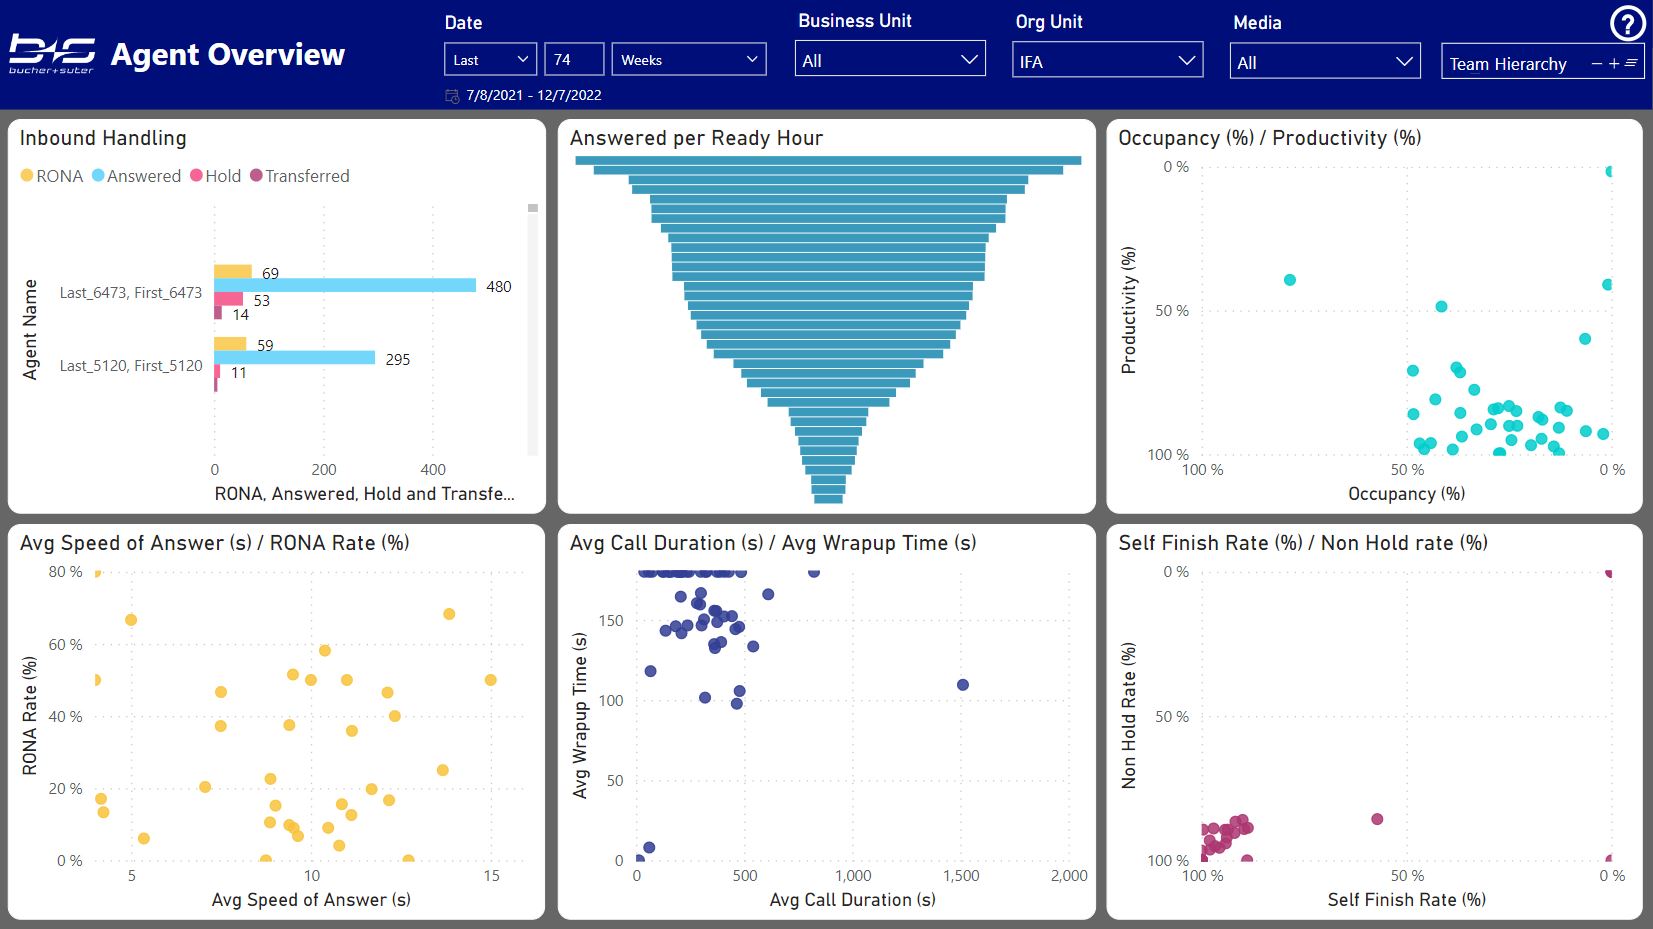
Agent Overview
This report provides an overview about the agent KPIs and their distribution.
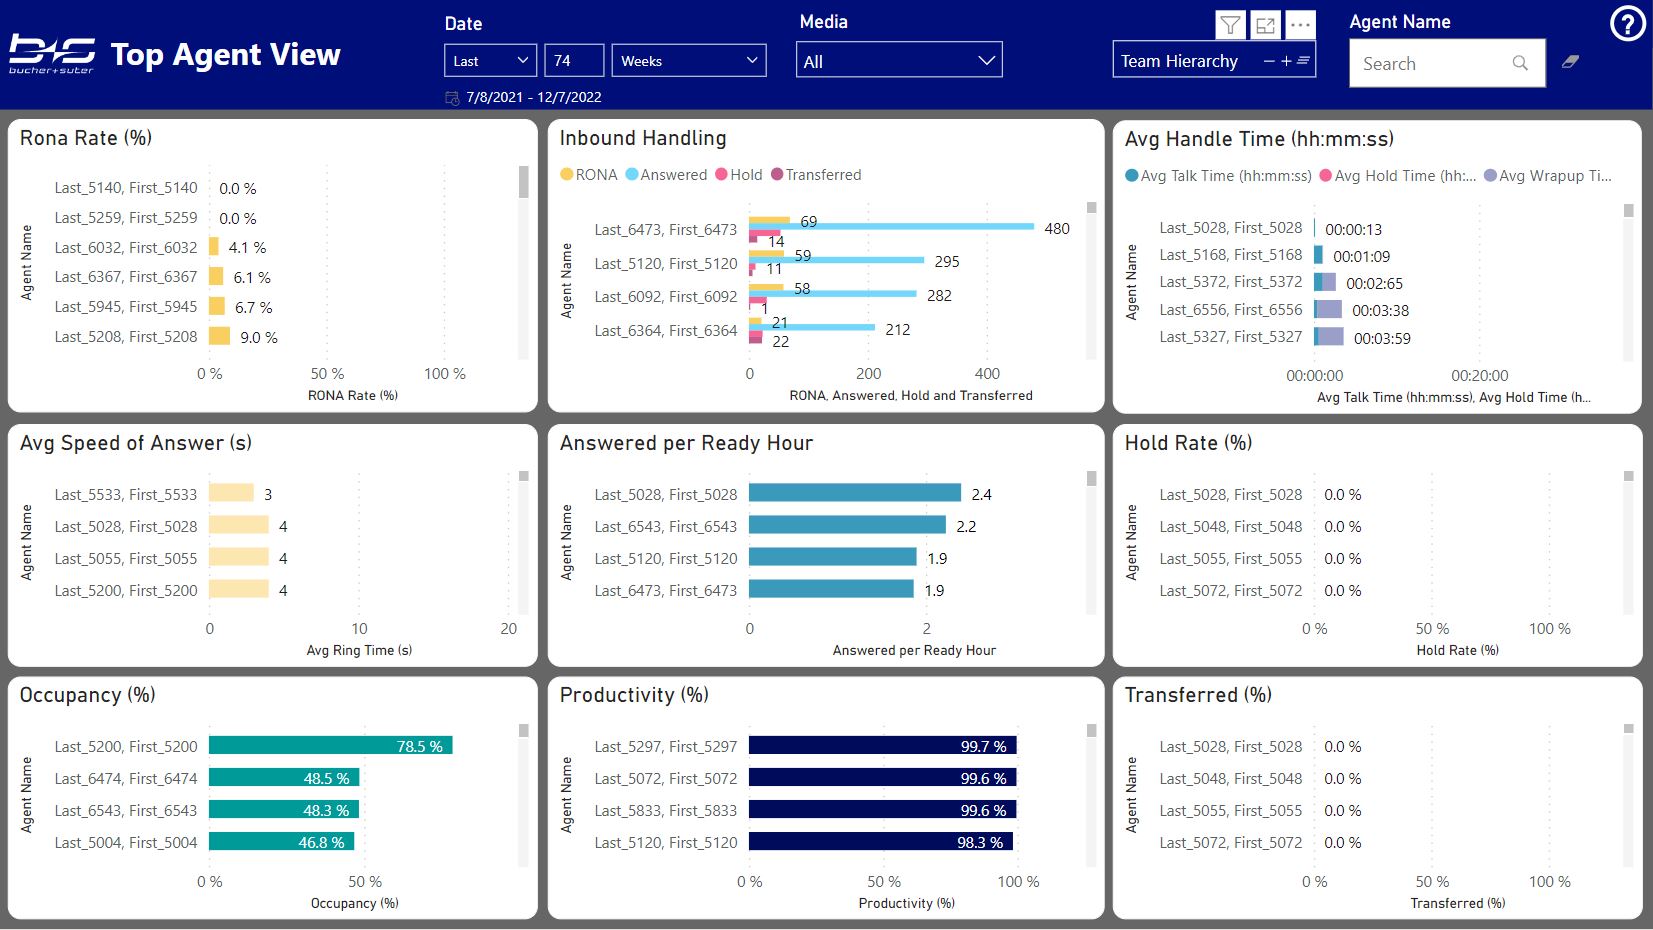
Top Agent View
This report displays the most important agent KPIs listed by agent names with the best agents on top.
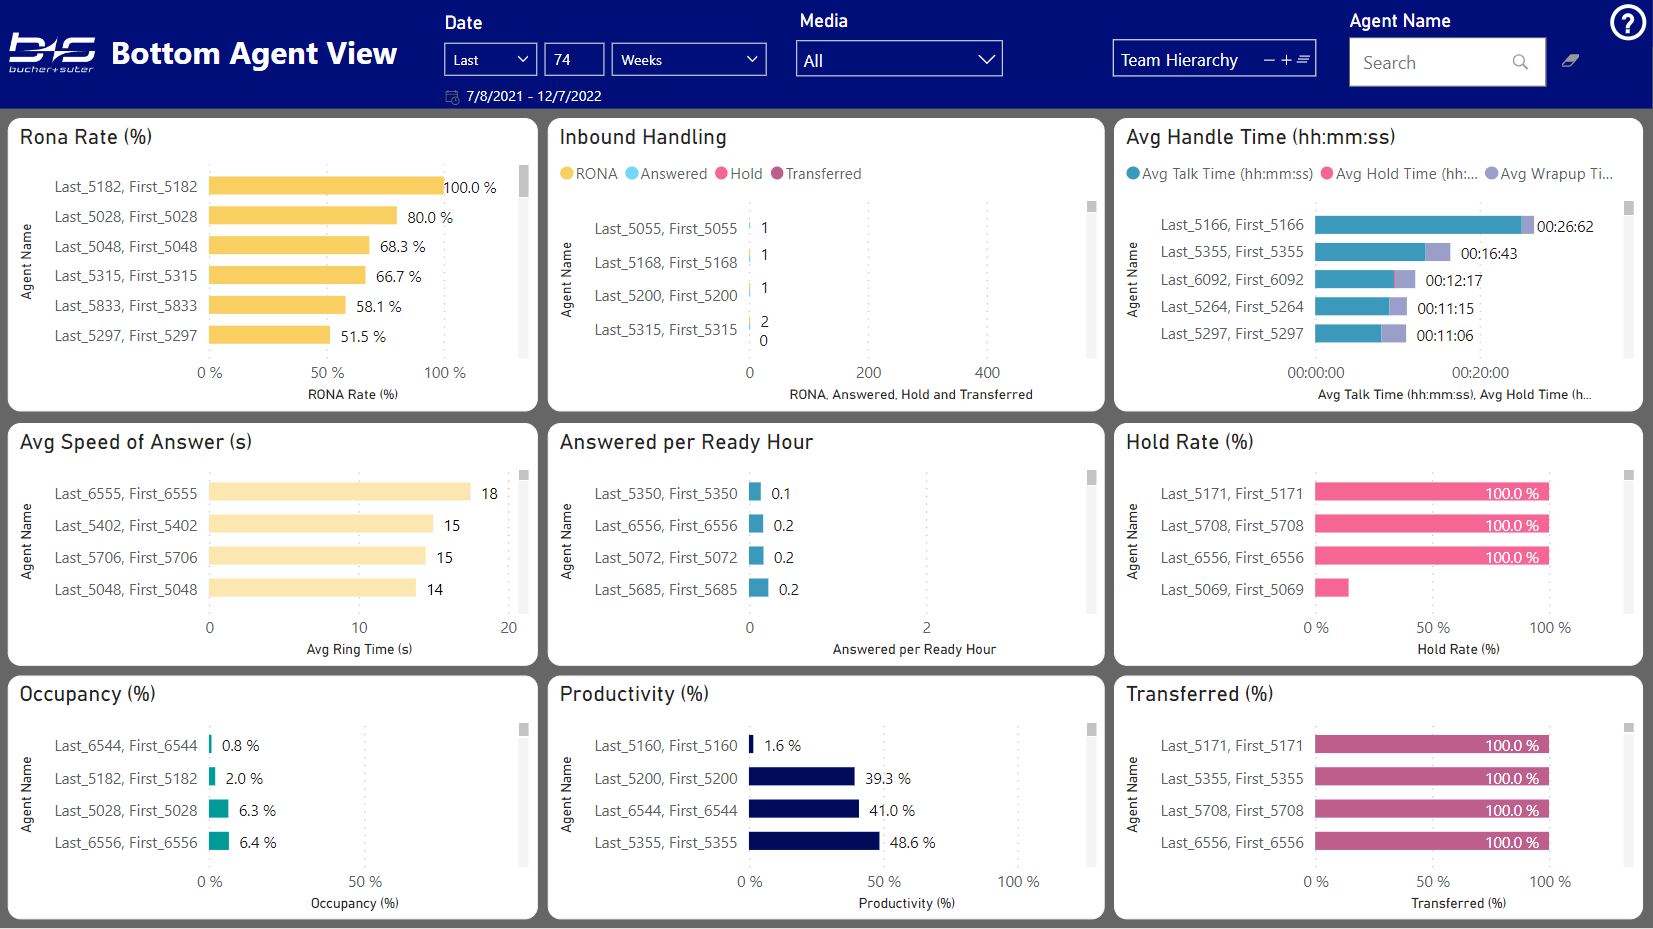
Bottom Agent View
This report displays the most important agent KPIs listed by agent names with the worst agents on top.
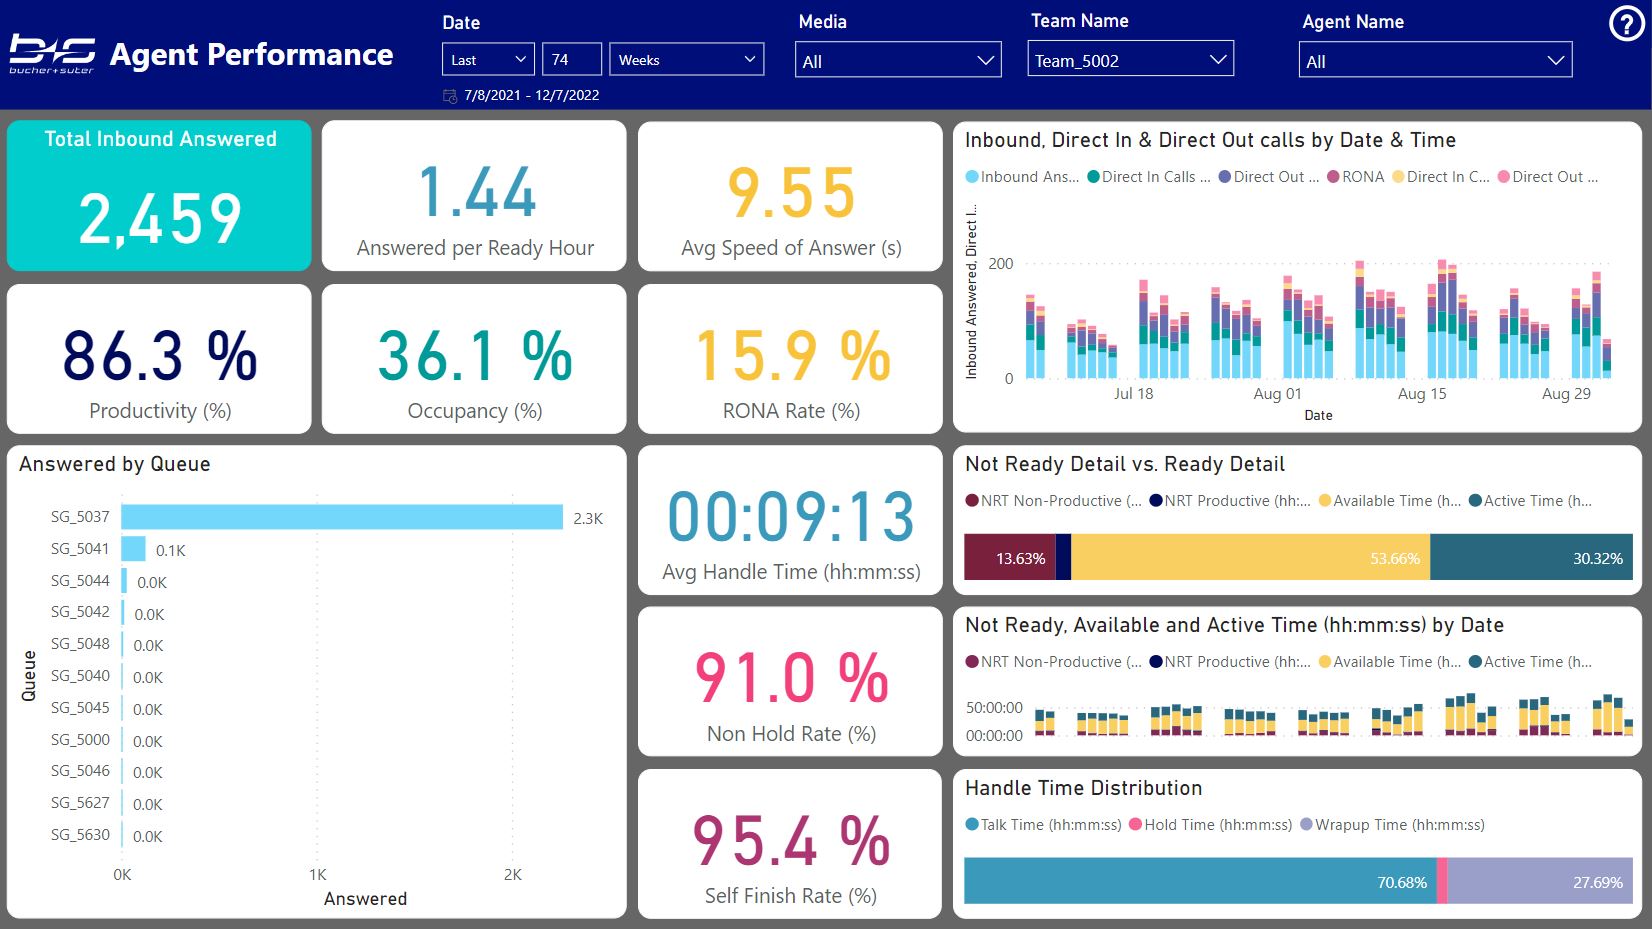
Agent Performance
This report gives you an overview about a single agent or a team, including the inbound handling, direct number activities, some KPIs and the state durations during the login sessions.
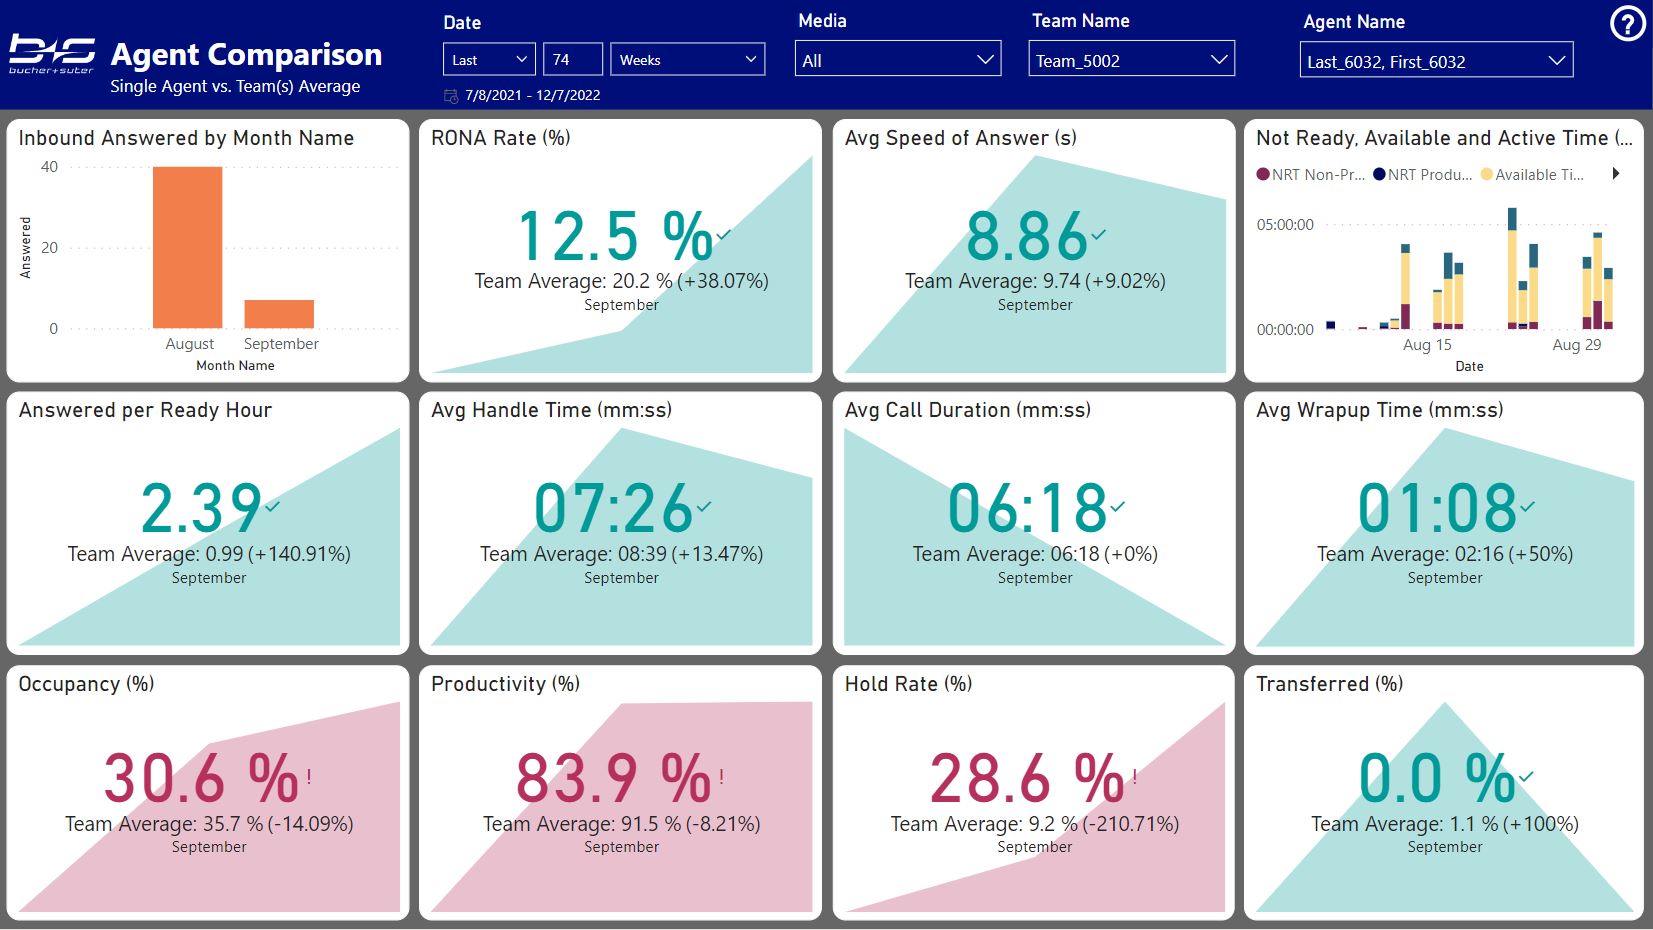
Agent Comparison KPI
This report allows you to compare a single agent with one or several selected teams. The KPI visuals contain the end value of the KPI for the agent and its course over time. The color indicates the value compared with the average value of the team(s) – green means better, red means worse than the team.
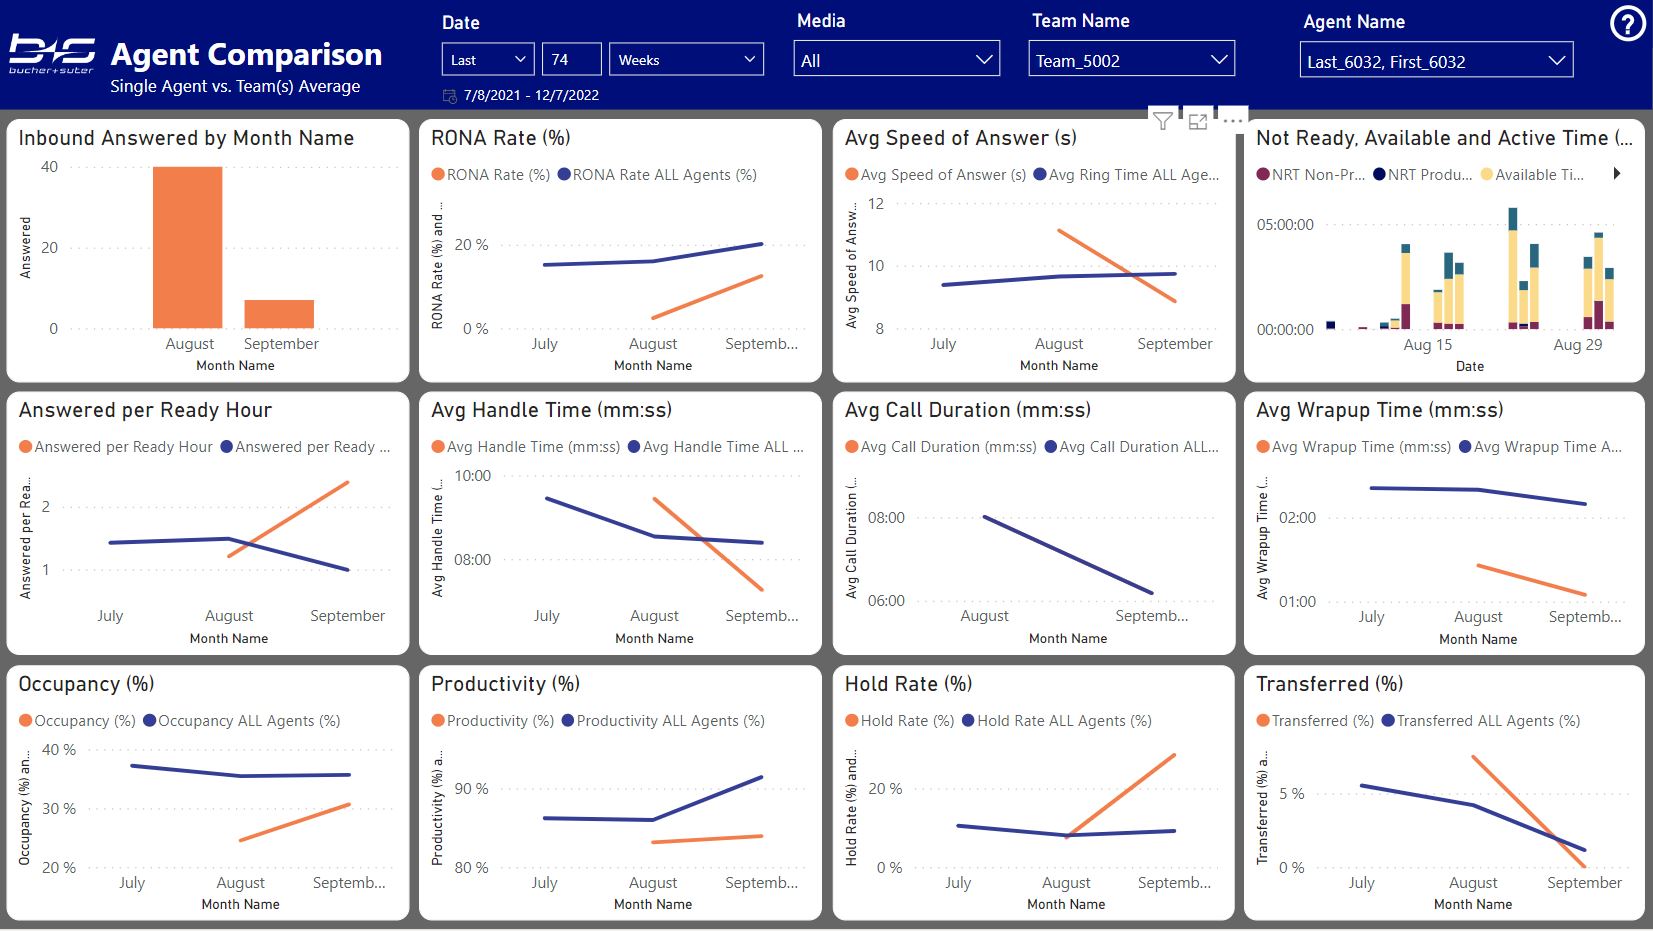
Agent Comparison Chart
This report allows you to compare a single agent with one or several selected teams. The line visuals contain the course of the KPI for the agent in orange and the team(s) in blue over time.