Design

Architecture
The installation of the Reporting Interface must be done onto a separate SQL Database Server due to a Cisco requirement. It represents a complete data mart solution including a custom database "bs_Reporting", where all reporting data is stored. It holds views to access the local reporting database and the distributed Cisco database.
Historical data is frequently loaded from one or more DAWs while Real time data is converted and directly passed from its original source.
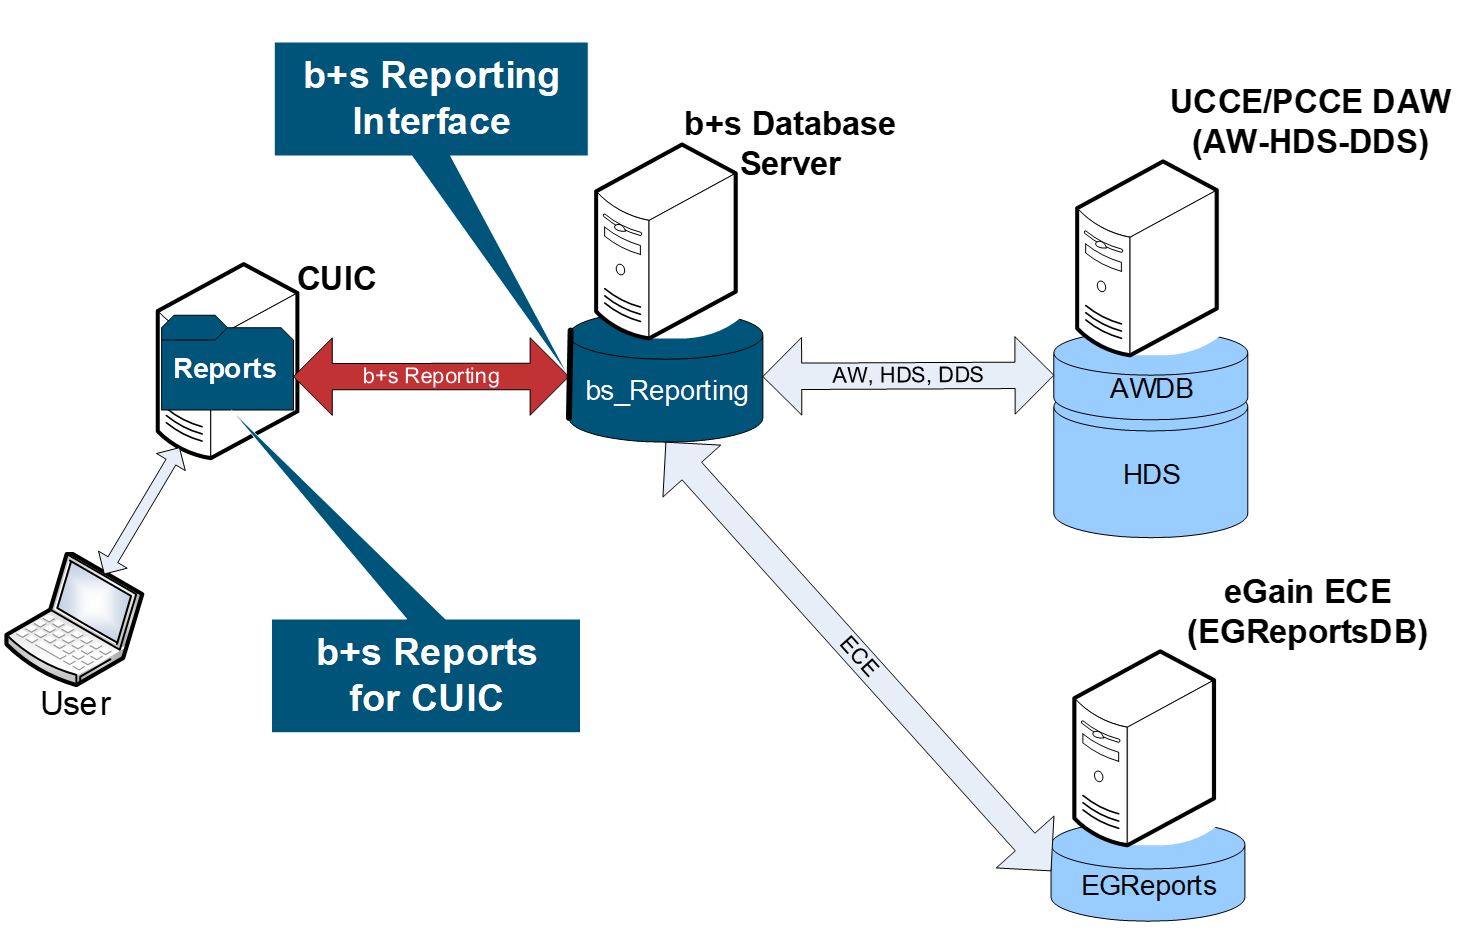
The Interfaces and Reports are separated into a Basic-Package and an optional CallByCall-Package.
Redundant systems
A full redundant reporting system requires at least 2 Database Admin Workstations (DAW), 2 b+s Database Servers and 2 CUIC Cluster-Nodes. The following picture shows the abstract system with its primary and secondary connections and the synchronization links:
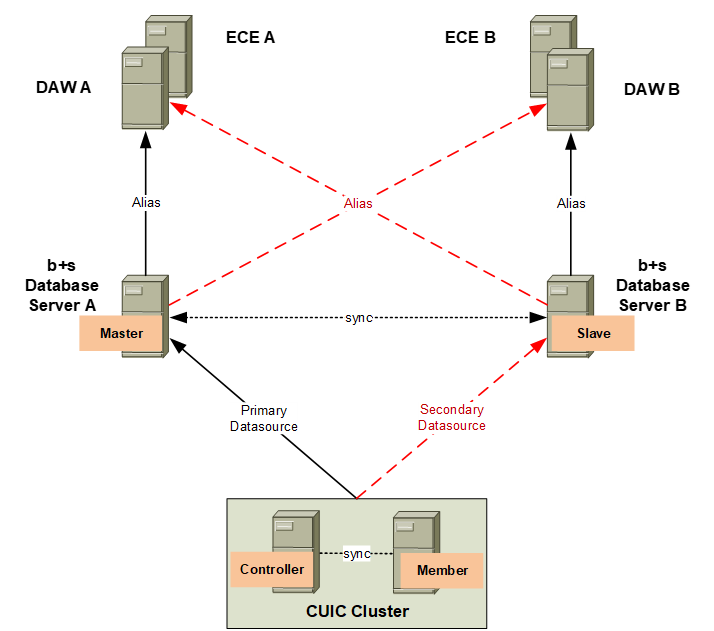
The system will keep running without any loss of functionality, if at least one server of each level is working.
Note: Switching the alias of the b+s database server is a manual configuration step and is not related to any failure.
Master/Slave replication
Configuration data of the b+s database servers gets synchronized with a master/slave replication. The connection and process is running onto the Slave node(s) based on a regular job.
CUIC administrative reports can only write data into the database with an active CUIC datasource to the Master node.
Time zone functionality
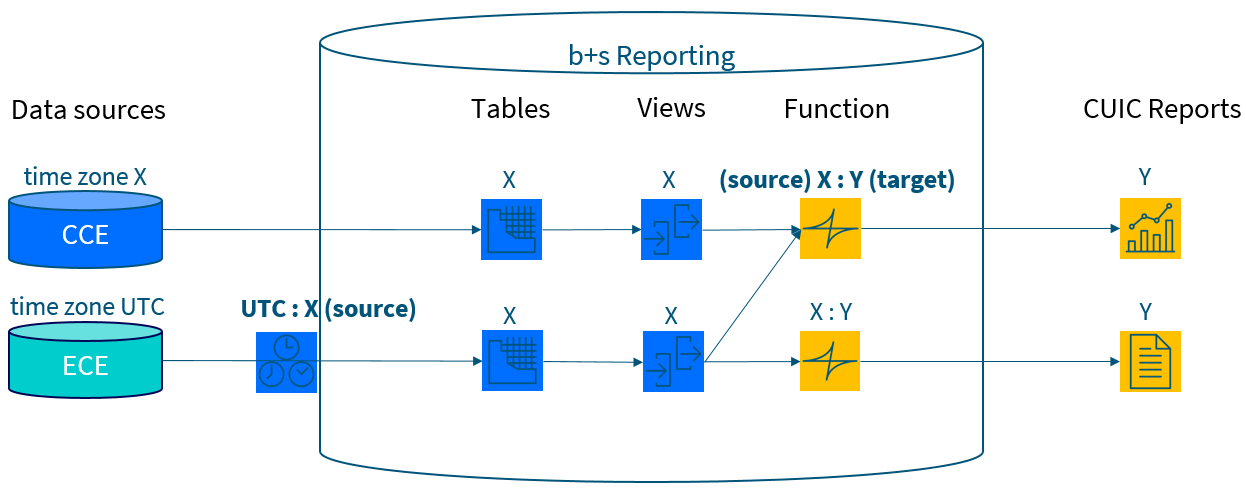
b+s Reports for CUIC offers a dedicated time zone functionality, which allows central controller data to be converted to any other time zone. This feature is useful for world-wide deployments working with one central controller (CC).
CUIC offers an out-of-the-box time zone functionality, which works fine for Interval and Call Detail reports. However, it comes with some limitations: there is a limit of 8000 rows per query, which can easily be exceeded when working with Interval or Call Detail data. When using a Daily report instead, another limitation has to be considered: daily aggregates are based on a database level, which can result in data being displayed on the wrong day. Furthermore, CUIC's time zone functionality does not work with real time reports.
b+s Reports for CUIC improves on the CUIC time zone functionality by enhancing the existing features. This requires that there is a dedicated b+s Reporting database server for each location, or one b+s Reporting database with one or more Viewer databases on the same server. Additionally, a CUIC installation with the respective time zone configured is required. It is recommended – but not mandatory – to set the user's time zone within CUIC to support CUIC's time zone functionality with an offset to the local CUIC installation.
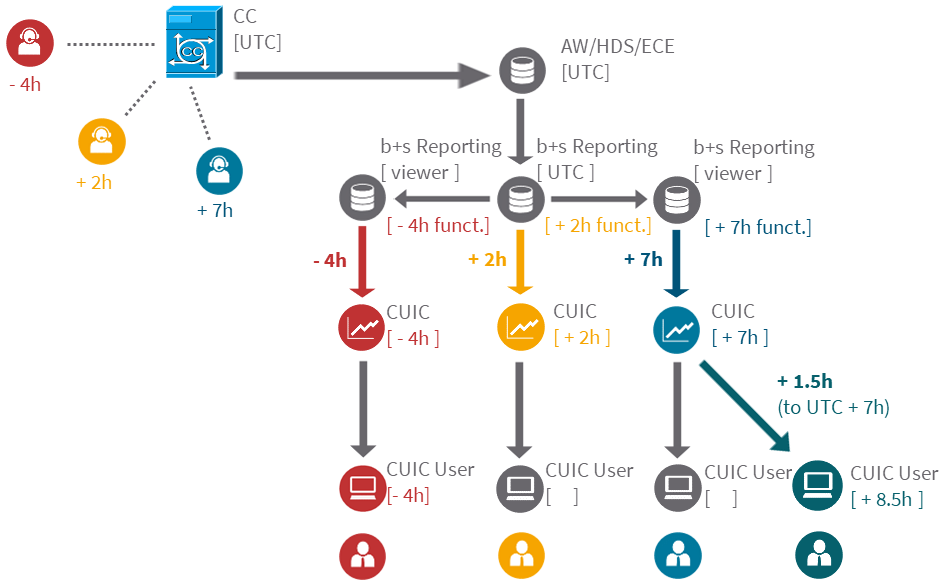
The data from the AW/HDS are loaded into the b+s Reporting database without any time zone conversion. A function was added to the database, which is being used within historical reports: data are converted from a configurable source time zone to a configurable target time zone.
ECE data are always stored in UTC and are converted to the same source time zone as configured for CCE within the load procedures and then both to the configured target time zone within the reports.
Note: If you have ECE data available and CCE does not store data in UTC, you have to have a proper time zone configuration in place before loading ECE data. Otherwise you will have an offset between CCE and ECE data. Reloading all ECE data is required if you change the source time zone afterwards.
Mapping of ECC Variables (CallByCall only)
Specify up to 10 Expanded Call Variables that should be included within the CallByCall Reports.
To see which Expanded Call Variables are available, do a "SELECT TOP 1000 Rows" on the view "Expanded_Call_Variable".
Adjustments for data retention periods
The default settings will delete CallType and Campaign interval data after 1500 days and all other data after 400 days.
Not Ready Reason Codes
Summary
This part provides information about how to customize Not Ready Reason Codes to be used within b+s Reports for CUIC. It covers the possibilities of grouping the existing codes to be shown as 20 categories of the "Not Ready Reason Time" within historical and real time reports. It also covers how to configure 3 groups out of the categories to be displayed within the agent state count pie charts. Additionally, this document also includes how Not Ready Reason categories can be set to be productive (e.g. back office) or non-productive (e.g. break). The configuration is part of the system setup and needs to be specified prior to the setup. This part should help to understand the functionality and can be shared with the end customer and the operational organization.
Functionality within Reports
Historical and Real Time Grid Reports
Agent/Team State Reports (335, 336, 346, 435, 436, 438, 439, 446, 466) and the report 411 Team Real Time State Counts uses 20 data fields (columns) where the duration and 20 data fields where the percentage of different Not Ready Reason Codes can be measured. Those fields are representing a category summary of several individual Not Ready Reason Codes because the number of configured codes can be much higher. Either because the same code meaning exists in different languages or the set and order of available codes differs between organizations.
Depending on the productivity configuration of the 20 categories, the reports separates the Not Ready Time in productive or non-productive time and provides several productivity KPIs.
This is an example of Report "346 Agent State Voice Daily" where the Not Ready Reason Percentage of the categories "Admin", "Break", "Chat" etc. and the "% Productive Time" can be seen:
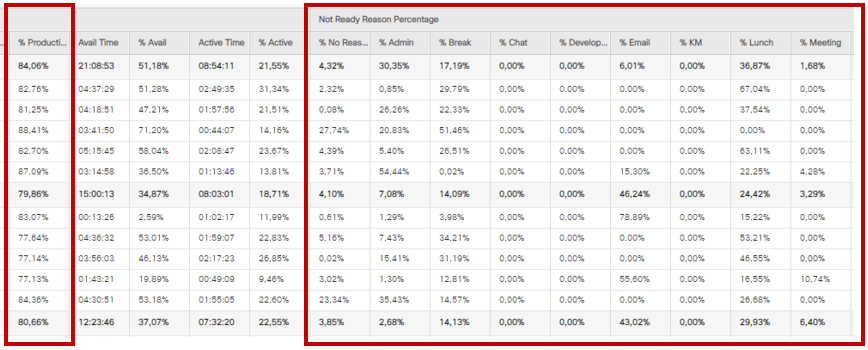
The column names of the 20 categories are dynamically taken from table "t_Reason_Code_Category" where the categories are configured.
Real Time Displays
Real Time State Counts Graph Reports (312, 313, 314, 412, 413, 414) show how many agents are within one of these states and provides the summary of 3 Not Ready Reason groups. All other reasons or where no reason was set is summarized as "Not Ready – Other".
These 3 Not Ready Reason groups are configured out of the 20 categories by assigning them to one of the top 3 categories within table "t_Reason_Code_Category".
This is an example of Report "314 Agent Real Time State Counts Graph - simple" where the count of agents with Not Ready Reason category groups "Break", "Lunch", and "Meeting" can be seen separately:
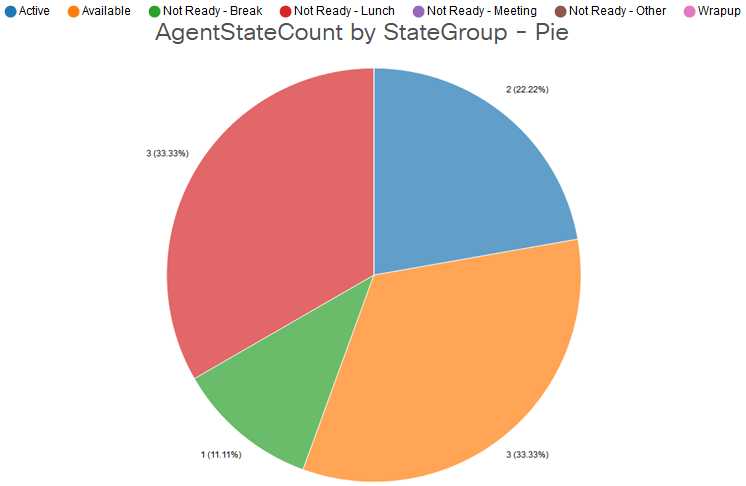
The name of the total 4 reason category groups used within the pie charts need to be configured once for the whole system within table "t_Agent_State_Group".
Configuration
Grouping codes within UCCE
From version 3.2 there are no extra reason codes required to be configured in CCE for grouping purposes. The whole grouping and categories are configured within database "bs_Reporting".
Reason Code Mapping
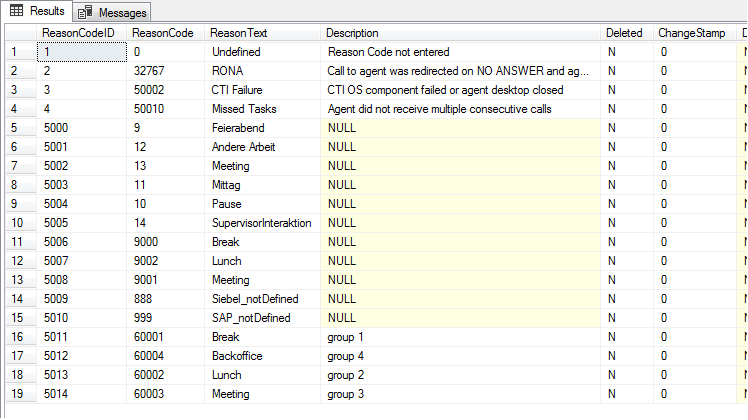
Start with discovering the existing Reason Codes of the CCE configuration by selecting them from table "t_Reason_Code":
Also open table "t_Reason_Code_Category" to display the 20 categories that get implemented by default and might have been modified already:
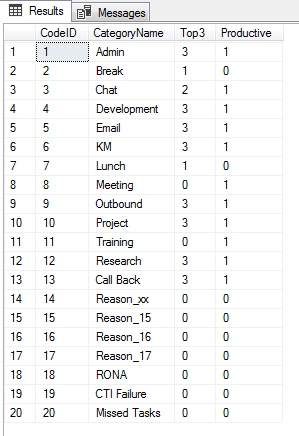
Specify those categories as far as needed by entering a meaningful CategoryName and leave the unused categories with their default name "Reason_<CodeID>".
Now you can configure which ReasonCodes from table "t_Reason_Code" should belong to which CodeID of table "t_Reason_Code_Category".
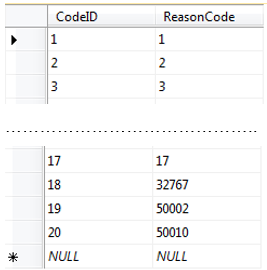
Here for you have to edit the table "t_Reason_Code_Mapping" and fill in all required ReasonCodes. This table already covers a default mapping for ReasonCodes 1-17 and the existing system codes:
Edit this table by following those steps:
- Overwrite ReasonCode 1 with the number of your first ReasonCode that should belong to the first category. Add a new record with CodeID = 1 and the ReasonCode for all ReasonCodes that should also belong to the first category.
- Overwrite ReasonCode 2 with the number of your first ReasonCode that should belong to the second category. Add a new record with CodeID = 2 and the ReasonCode for all ReasonCodes that should also belong to the second category.
- Repeat the same procedure for all other categories that need to be configured.
- Remove the default mapping for those Reason Codes 1-17 that are already assigned to another category by entering 99999 as a placeholder. Do not delete any of the 20 default records.
Note: The remaining ReasonCodes that are not mapped to any category will be reported as "NoReason" within Grid Reports and "Other" within pie charts.
If all records have been entered into the table "t_Reason_Code_Mapping", you should check the configuration with a "Select Top 1000 Rows", which will show a better sort order:
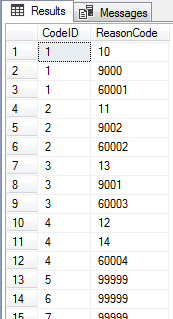
Note: Make sure that you have entered the same ReasonCode only once (except placeholders).
If the mapping of this table is changed, this historical data needs to be reloaded again (export_id 13: Agent-State-Interval-Export for Basic-Interface).
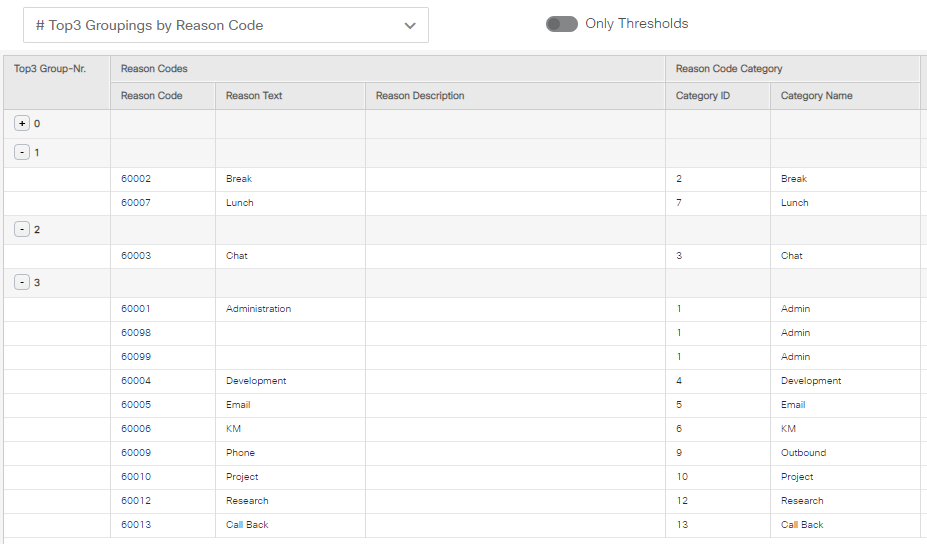
Top 3 Groupings for pie charts
Another setting that can be made in the table "t_Reason_Code_Category" is to determine the top 3 groups that should be displayed in the Real Time State Counts Graph Reports (312, 313, 314, 412, 413, 414). By default, the first 3 categories (Code IDs 1, 2 and 3) are configured as top 3 groups.
It is also possible to combine multiple Reason Code categories to be displayed as a summary in the mentioned reports. For that purpose, the same number (1, 2 or 3) can be set multiple times in the "Top3" column. In the screenshot of table "t_Reason_Code_Category" above, the two categories "Break" and "Lunch" are summarized as the first group (the column "Top3" is set to "1" for these two categories). The second group ("2" in the "Top3" column) is represented by the "Chat" category and several back office categories (e.g. "Admin", "Project", etc.) are all set as part of the third group, as the column "Top3" is set to "3". All other Reason Code categories that are not part of this top 3 are also summarized into a group called "Not Ready - Other".
Display Name for pie charts
The default name for the Not Ready Reason Code groups that are displayed within the pie charts of the Real Time State Counts Graph Reports have to be replaced manually.
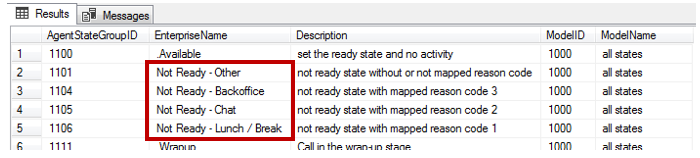
Edit the table "t_Agent_State_Group" and rename the "EnterpriseName" of all three models:
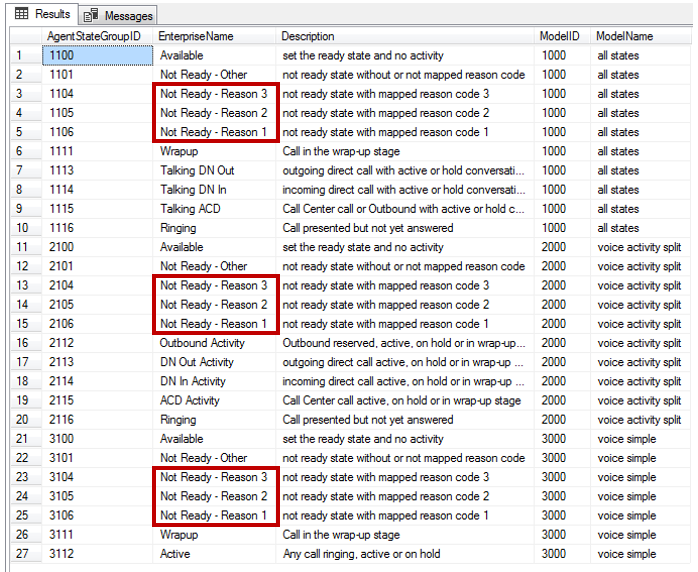
Replace the name part "Reason x" with a meaningful name for those groups configured as top 3.
In our example, the two Reason Code categories "Lunch" and "Break" have been defined as the first group, so the name could be "Lunch / Break". Several back office categories (e.g. "Admin", "Project", etc.) have been set as part of the third group, hence the name could be "Backoffice". The modified table should then look like this (only the first model is shown, but this has to be done for all three models):
Productivity Settings
Each Reason Code category can be configured to be productive (e.g. back office) or non-productive (e.g. break). By default, all categories are set to non-productive. In order to change categories to be productive, the table "t_Reason_Code_Category" has to be edited:
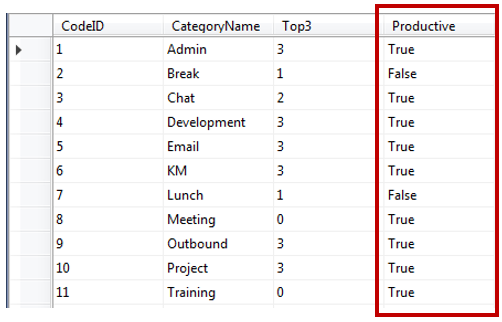
If a code group should be counted as productive, edit the column "Productive" and enter "True", or alternatively the digit "1". To change a code group back to non-productive, enter "False", or the digit "0".
If the Productive flag of this table is changed, this historical data needs to be reloaded again (export_id 13: Agent-State-Interval-Export for Basic-Interface).
Verifying the Configuration
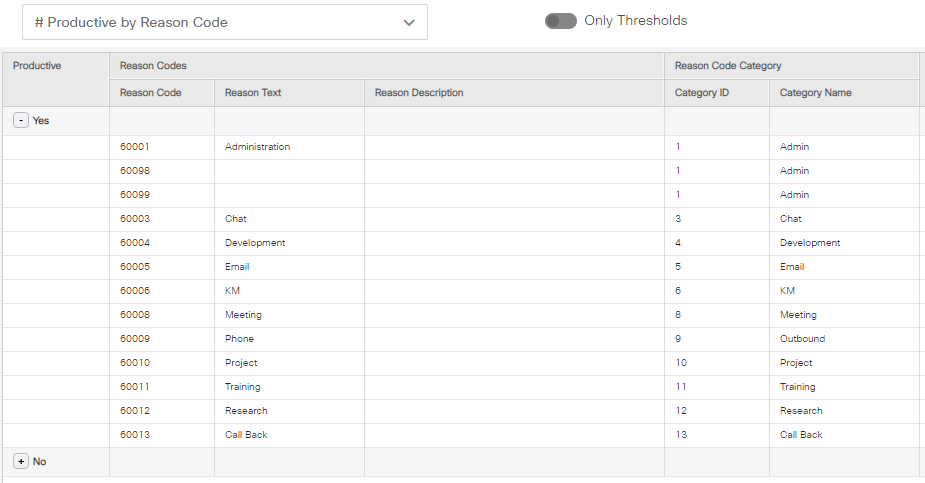
Use the report "990 NotReadyReasonCode Configuration" to verify the configuration. This report provides several views to get a quick overview of which Reason Codes belong to which category and have been set to be productive or which ones are set to be displayed in the top 3 categories of the pie charts:
The following view can be used to check what reason codes are set to productive and non-productive respectively:
The following view can be used to check what reason codes belong to which of the top 3 groups: