Manager
This report contains the following pages:
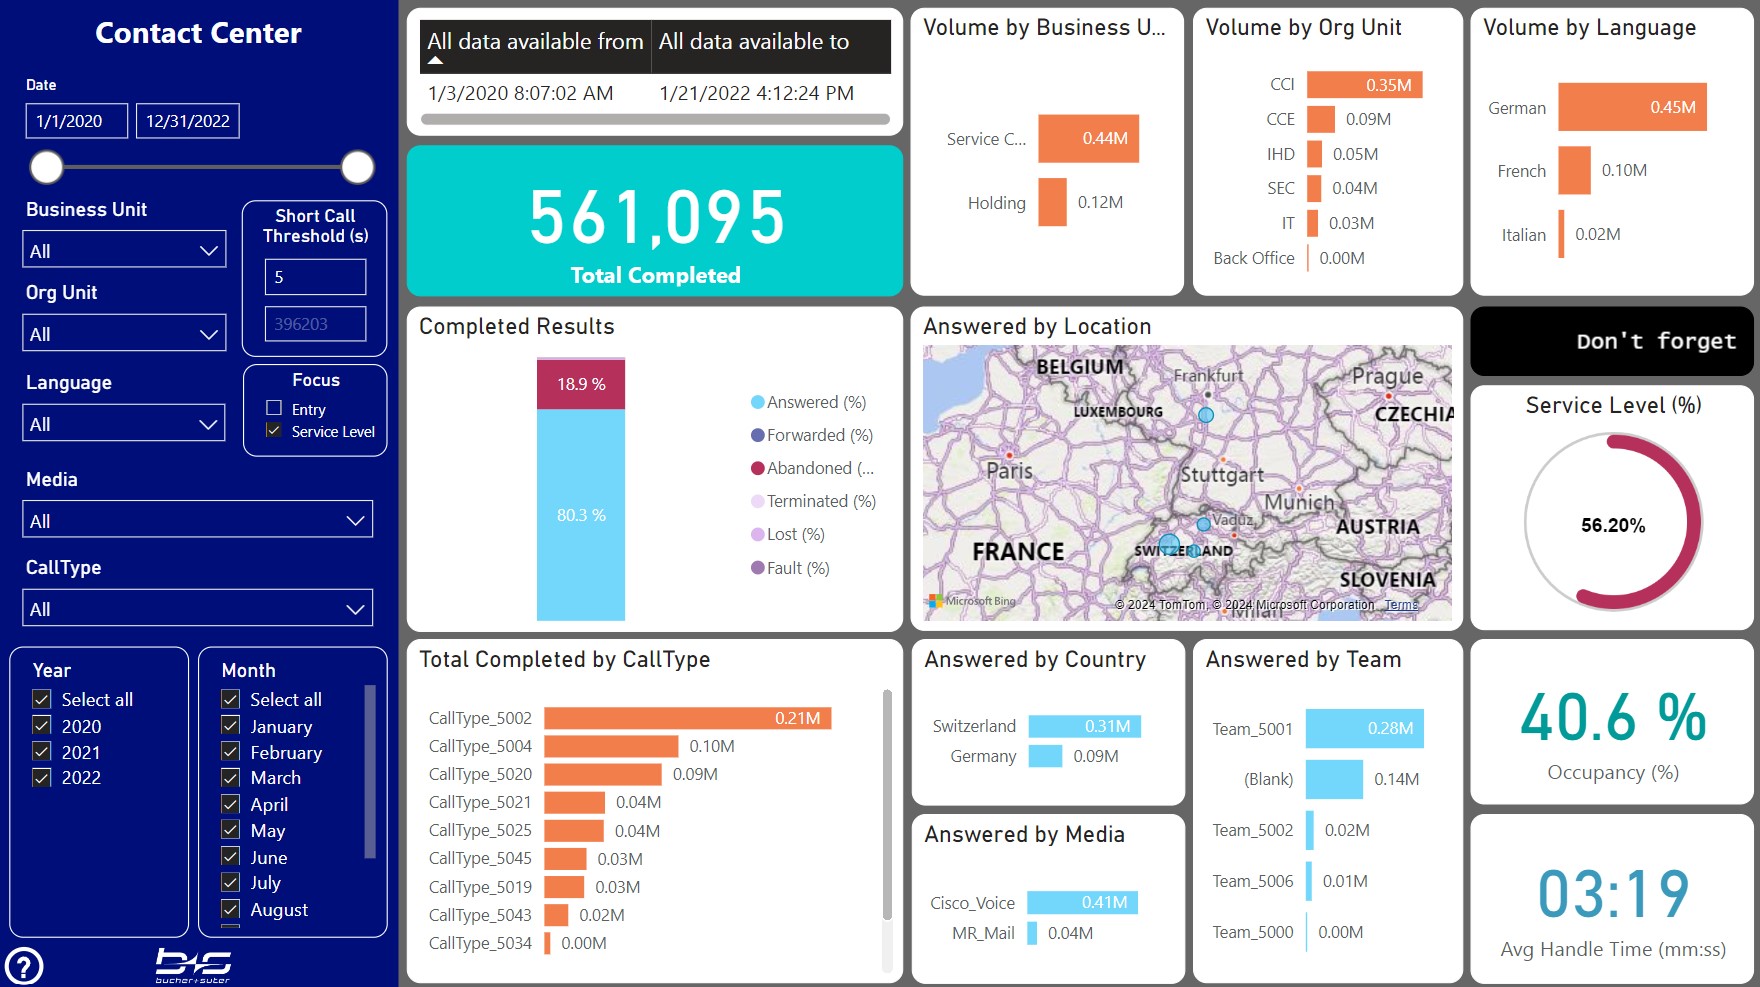
Contact Center
This report gives you a first overview about the whole Contact Center system at a glance.
You can easily see what is going on overall and it also contains the main slicer (filter) page.
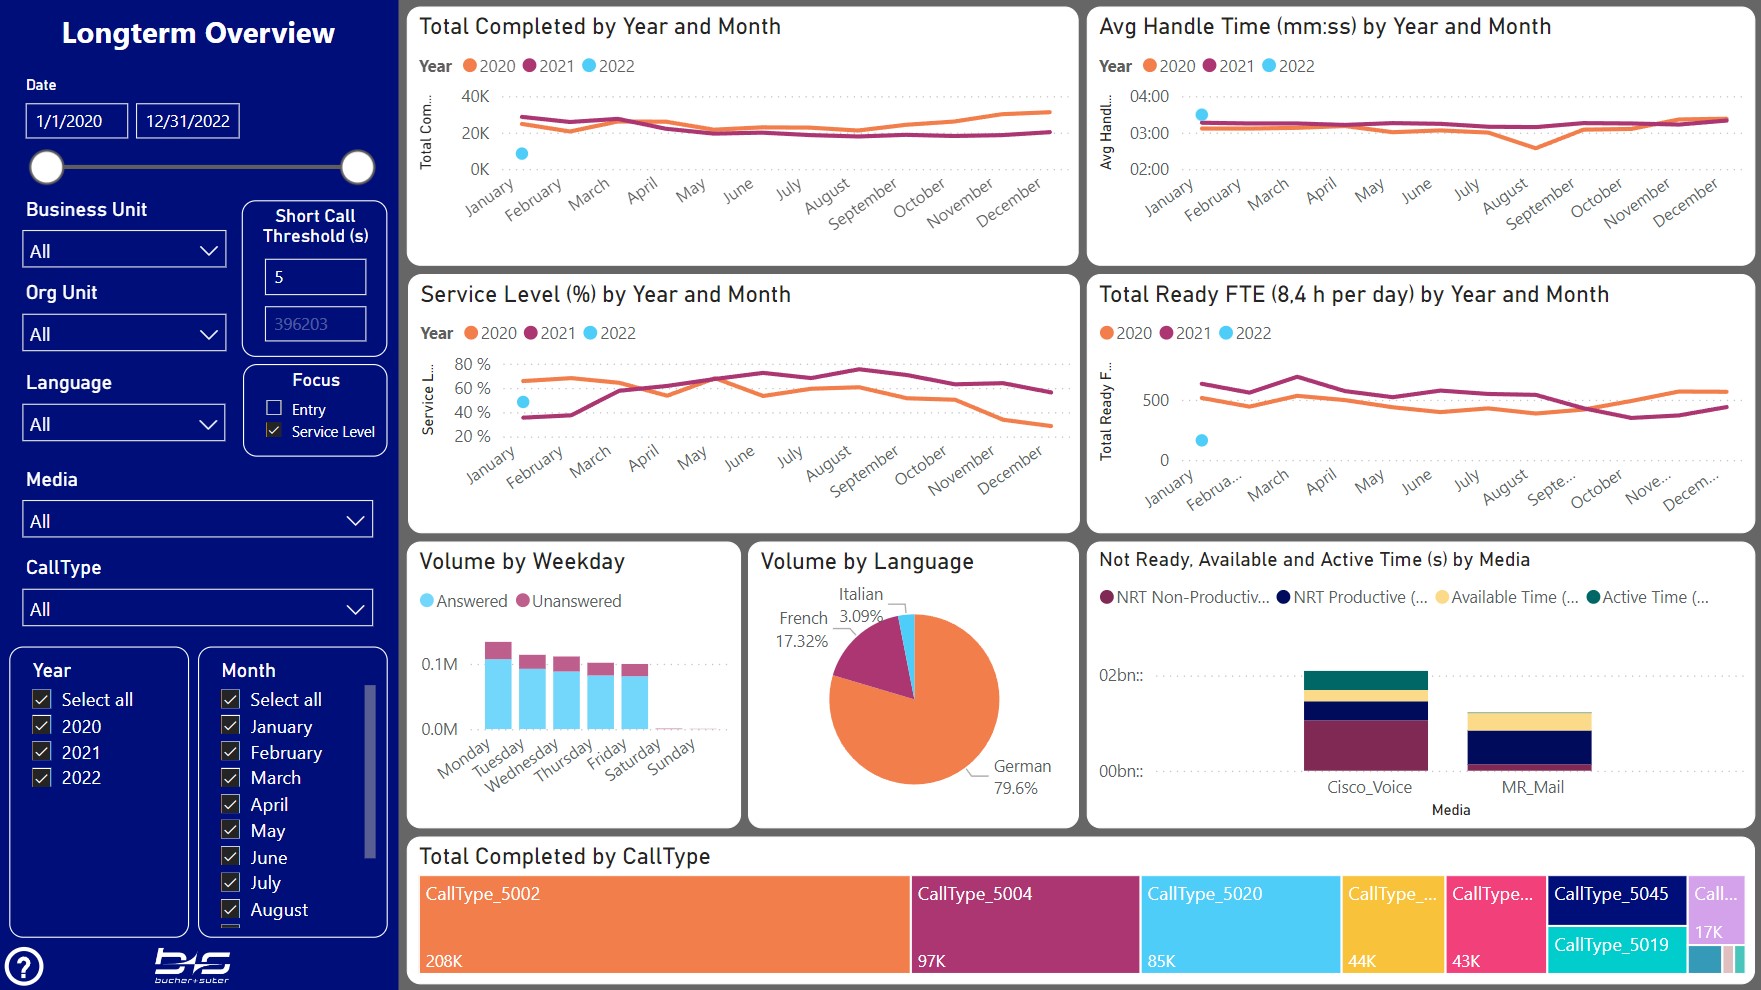
Longterm Overview
This report can be used to compare data between multiple years. To do so, the filter must be adjusted to include more than one year of data.
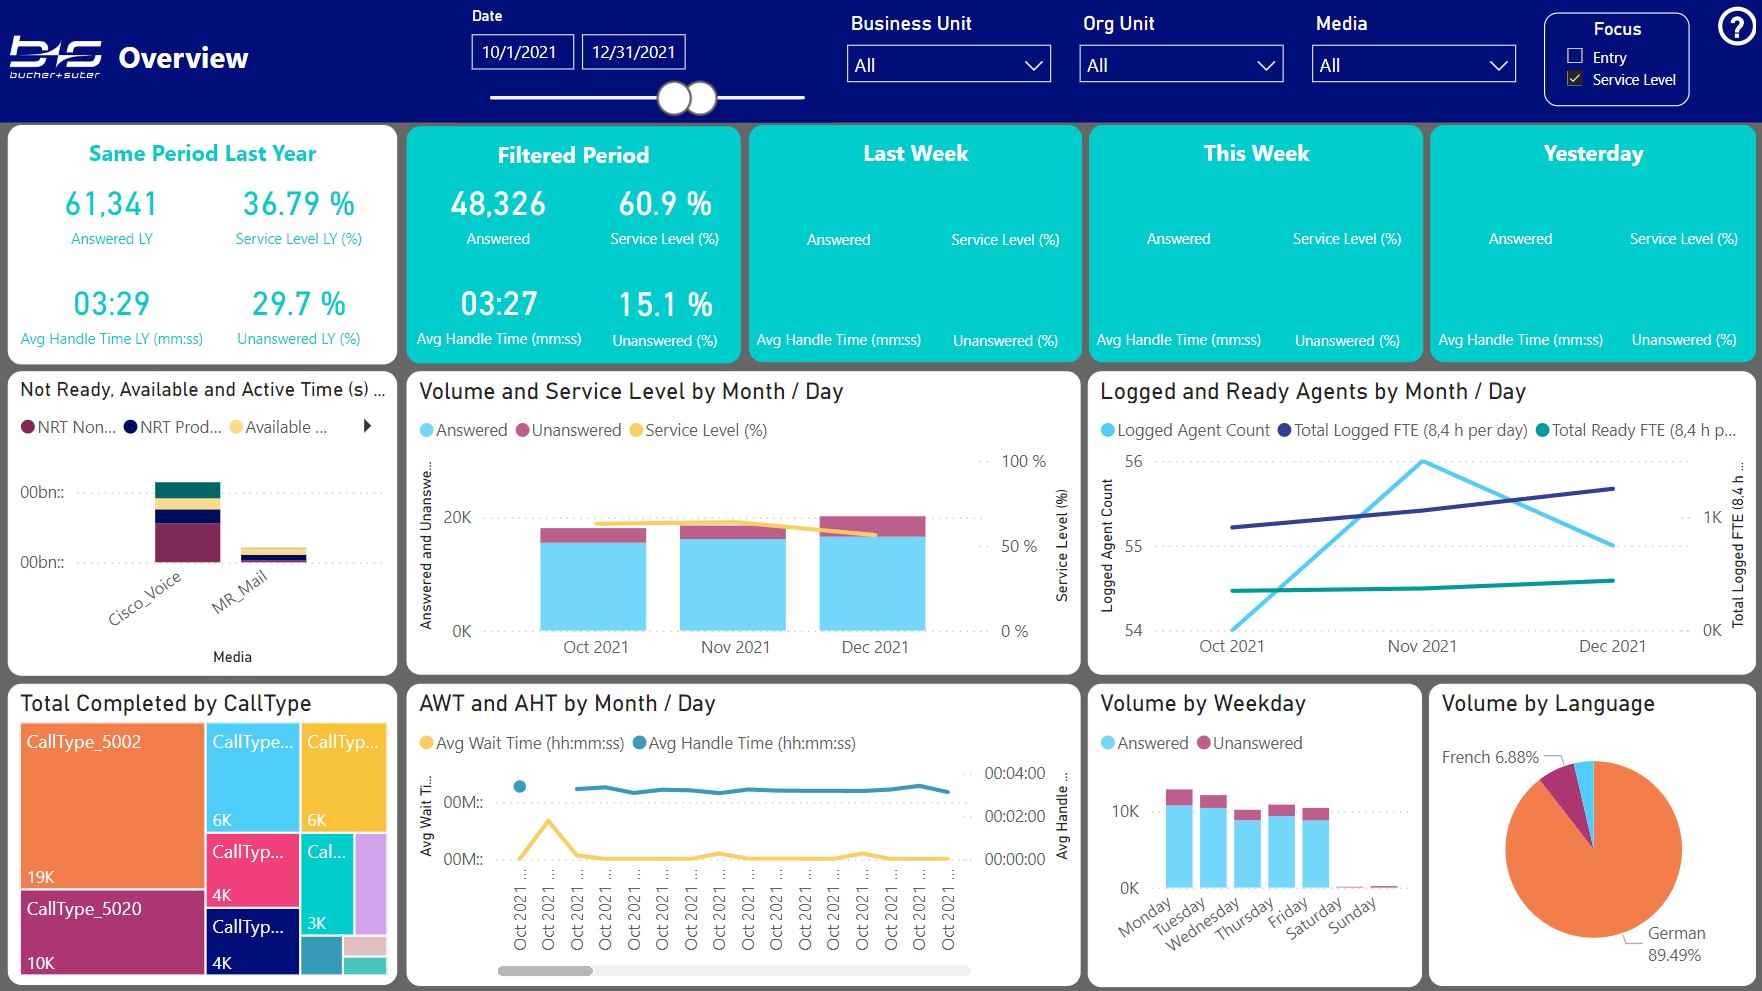
Overview
This report gives you an overview about the most important KPIs over a shorter period.
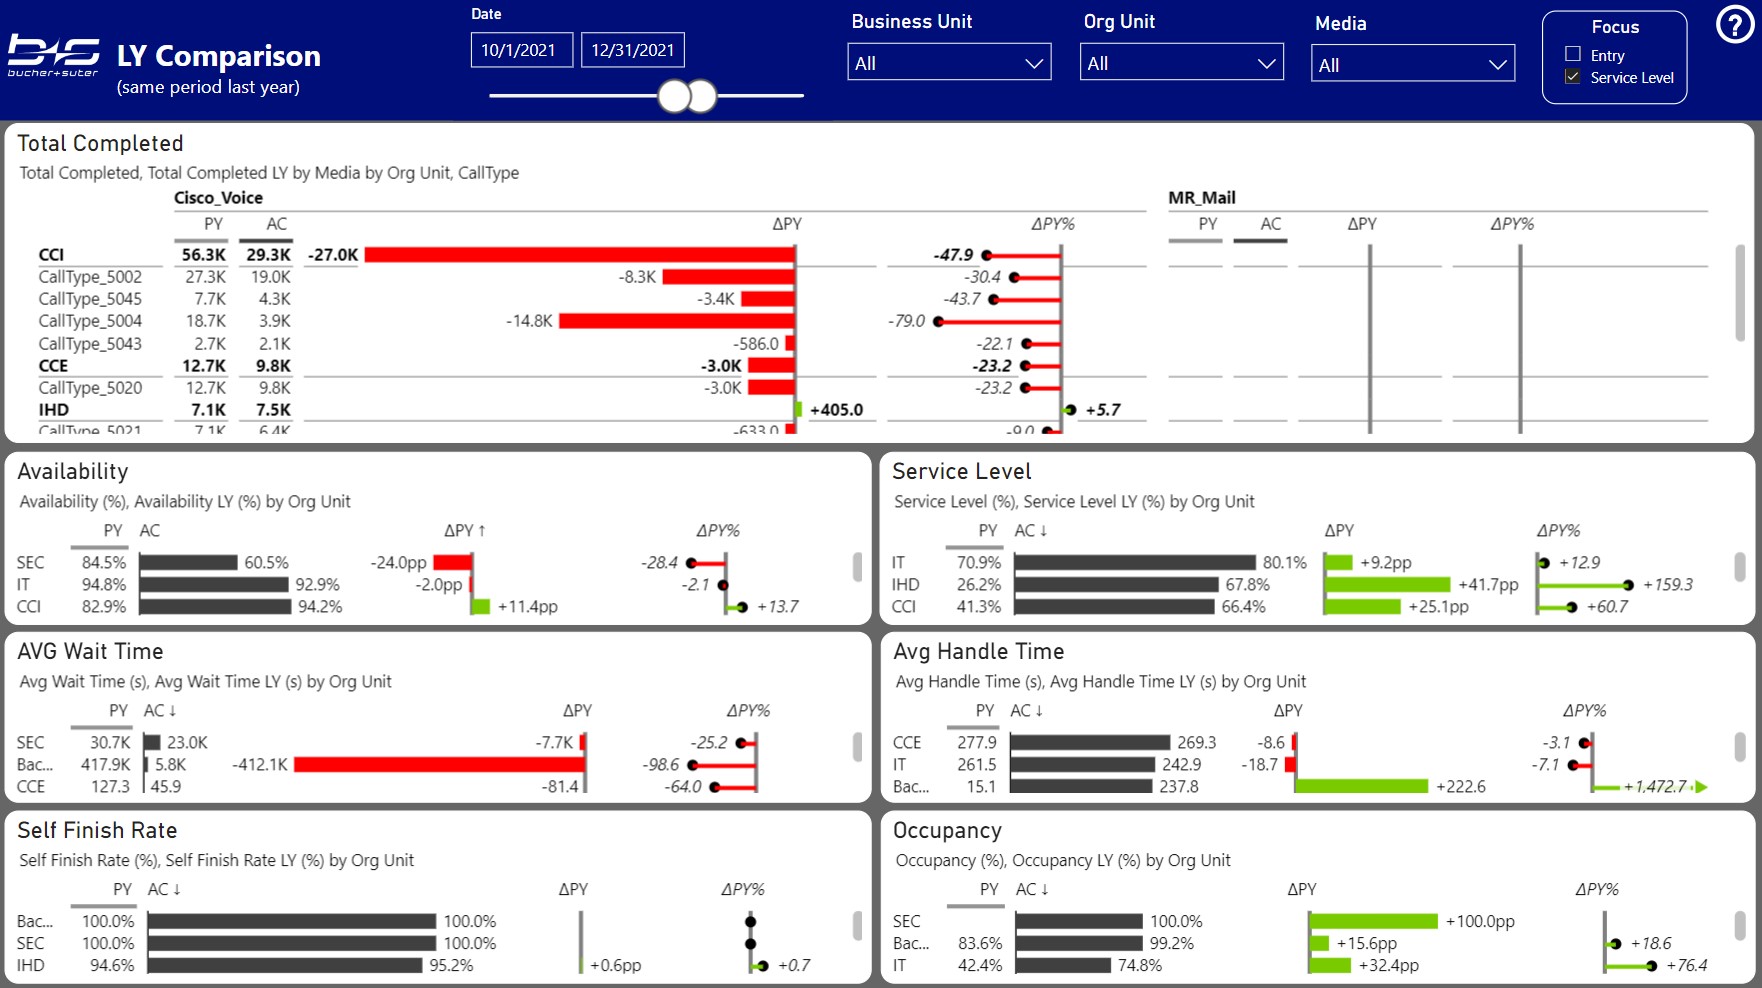
LY Comparison
This report displays the selected data (AC) compared with data for the same period of the last year (PY). If the current data is higher than last year, the differences are displayed positive in green. If the values are smaller, the differences are displayed negative in red.
Wait time and handle time reductions are positive trends but the differences are displayed negatively here – so be careful to read the differences correctly.
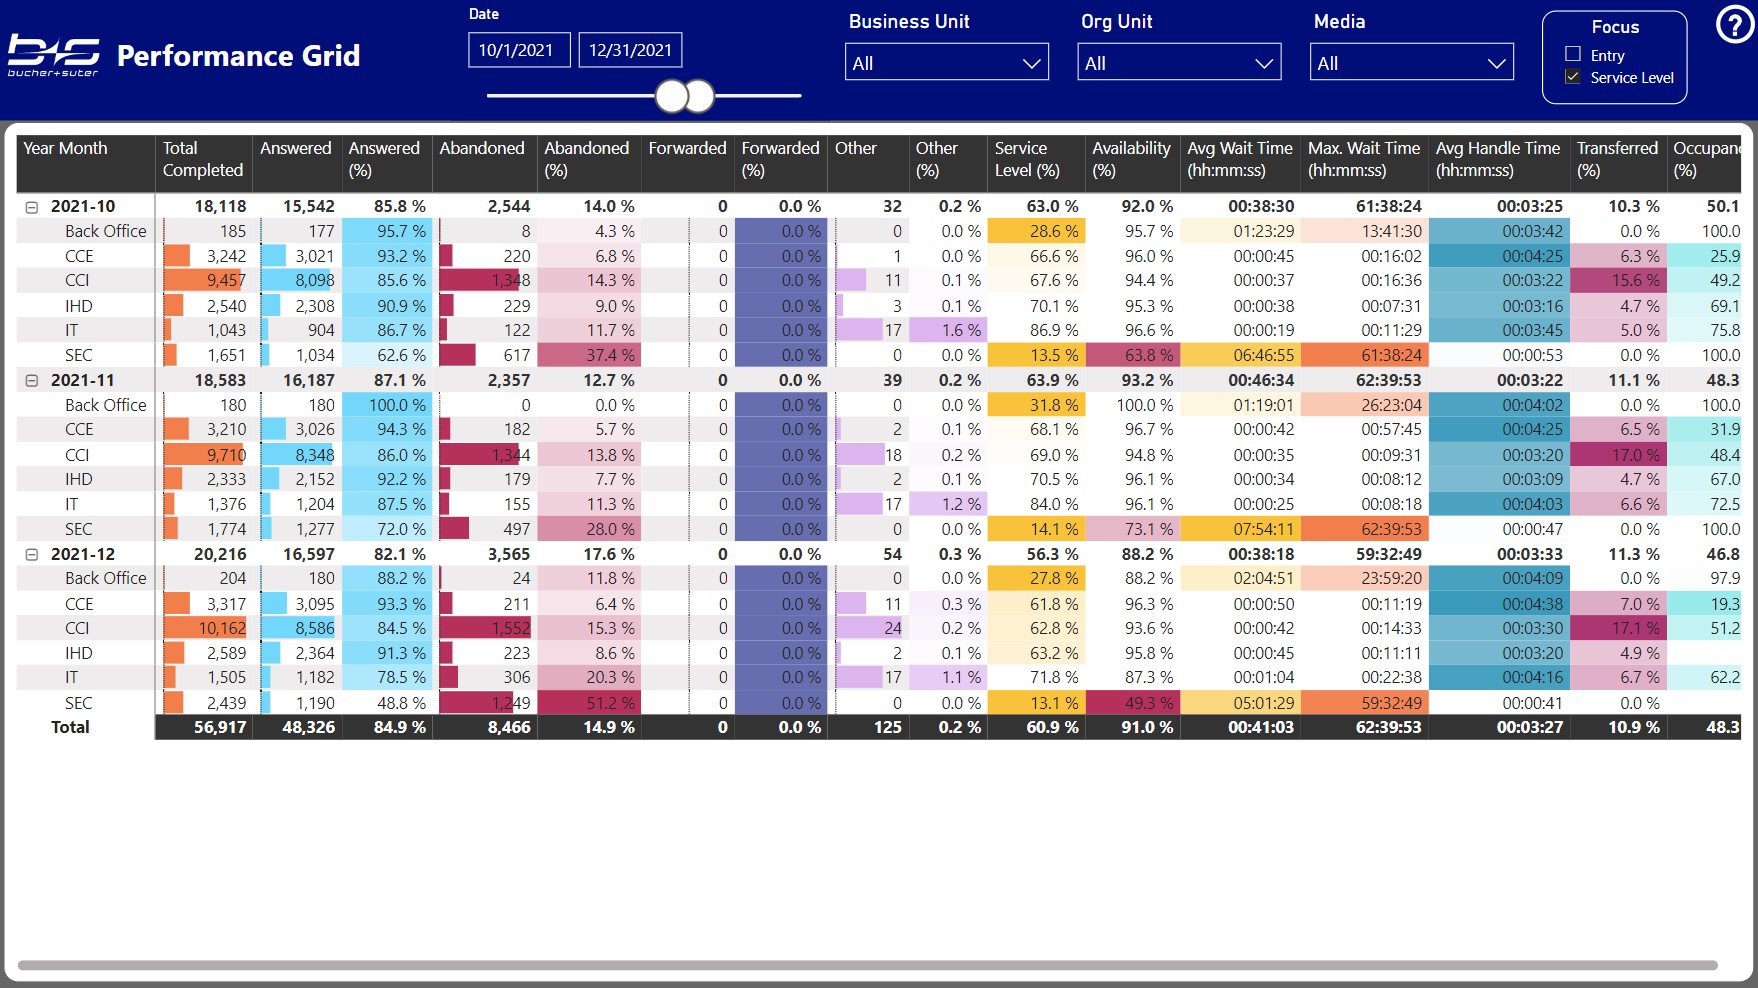
Performance Grid
Use this report to see the available measures in a tabular format including some groupings and conditional formatting.
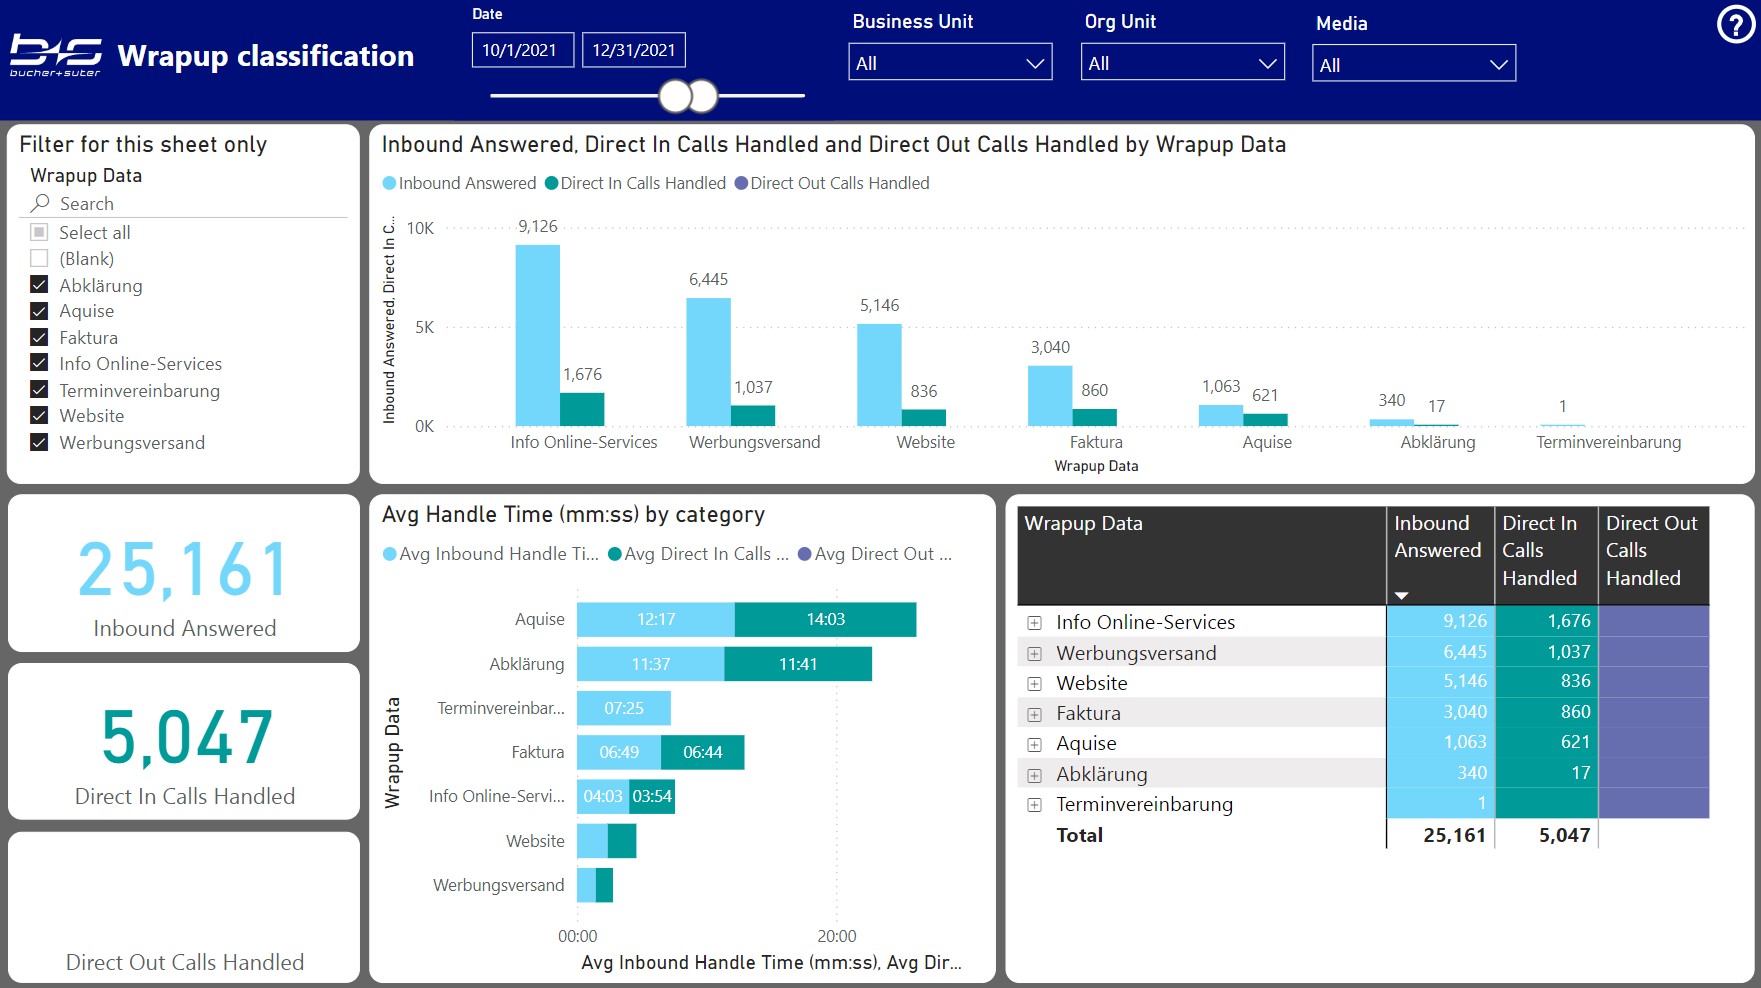
Wrapup classification
This report displays the volume and duration of all your classified contacts by its wrapup data and channel (Inbound, Direct In, Direct Out).
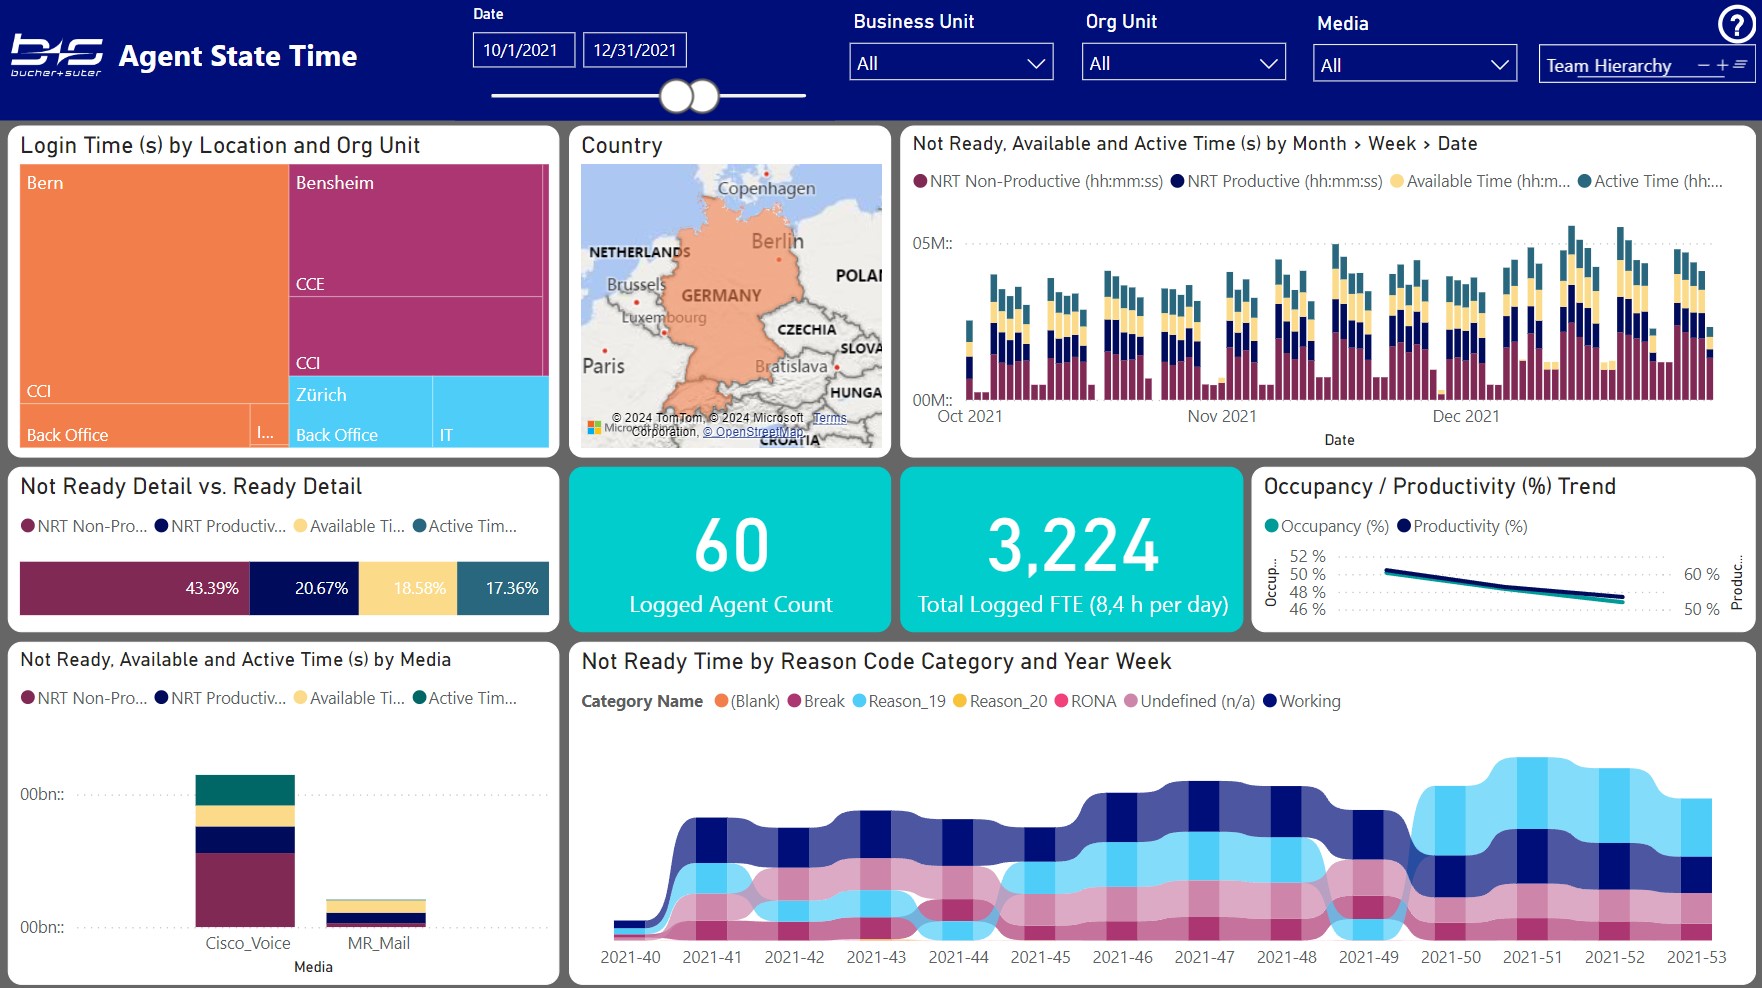
Agent States
This report gives you an overview about your available agents, their occupancy and activities during the not ready stage.
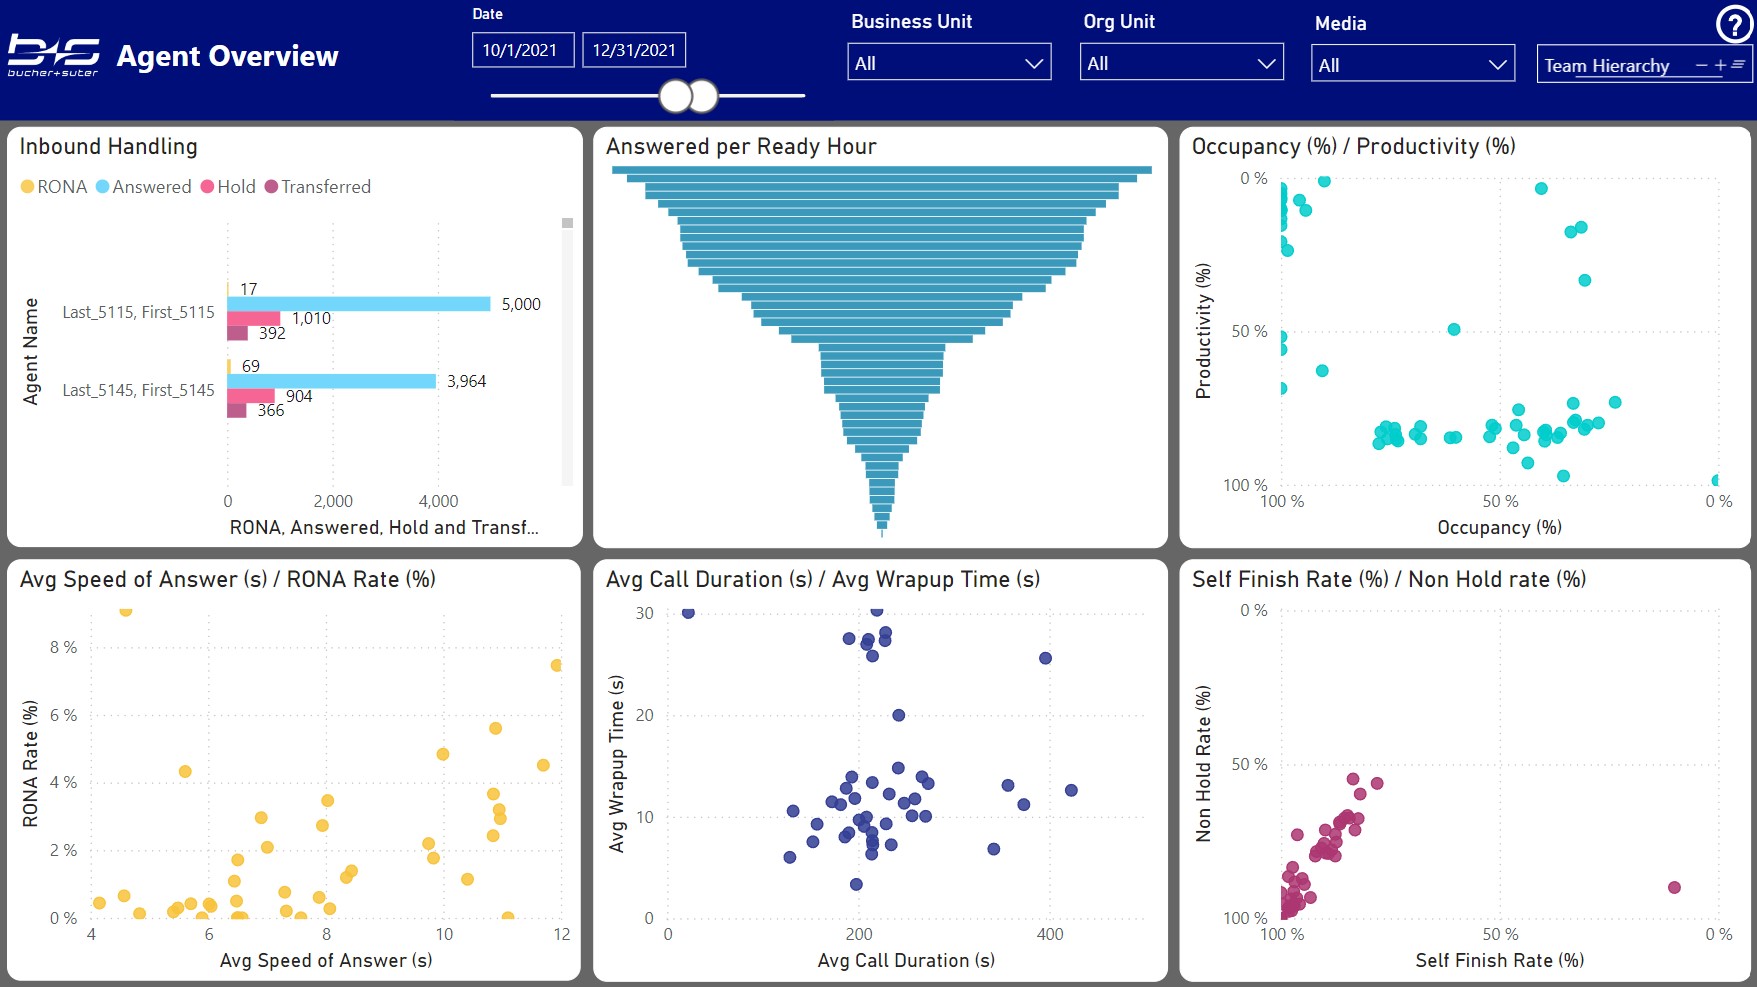
Agent Overview
This report provides an overview about the agent KPIs and their distribution.