Contact Center
This report contains the following pages:
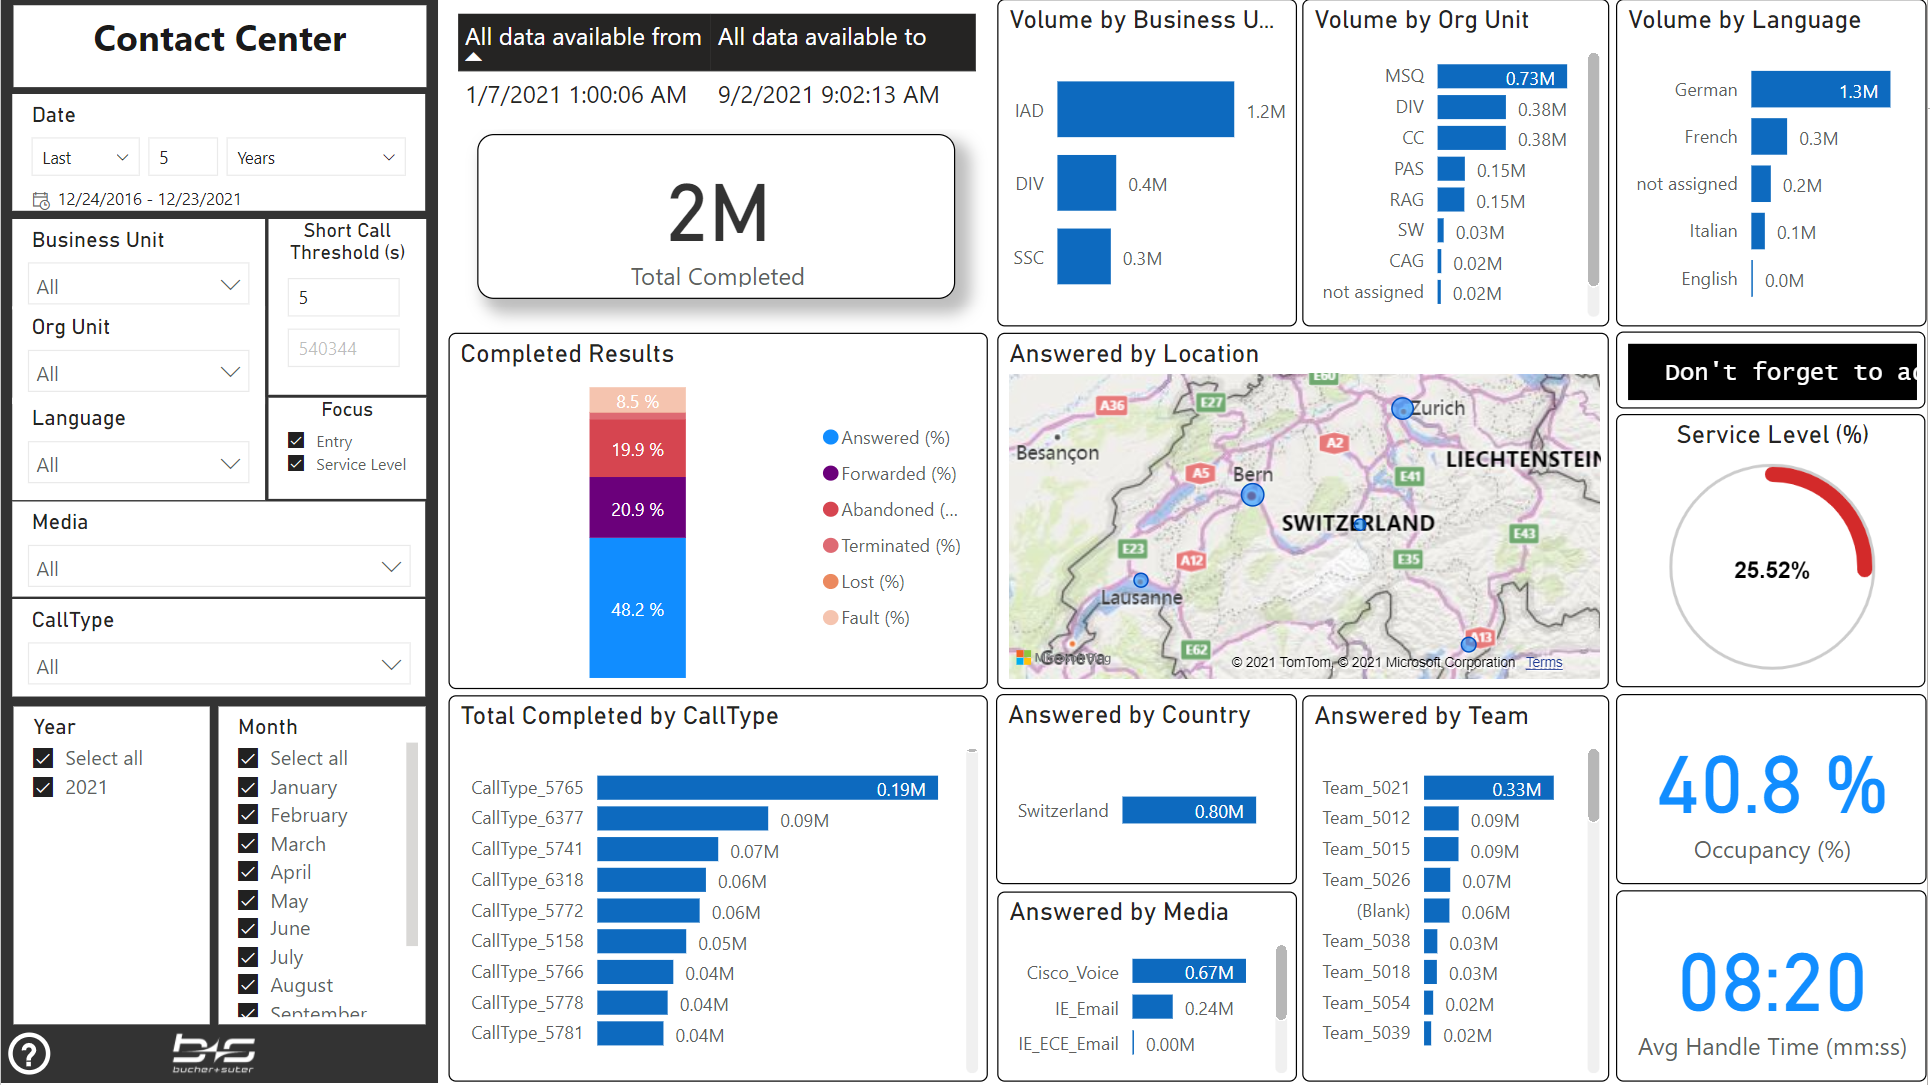
Contact Center
This report gives you a first overview about the whole Contact Center system at a glance.
You can easily see what is going on overall and it also contains the main slicer (filter) page.
Customer Journey
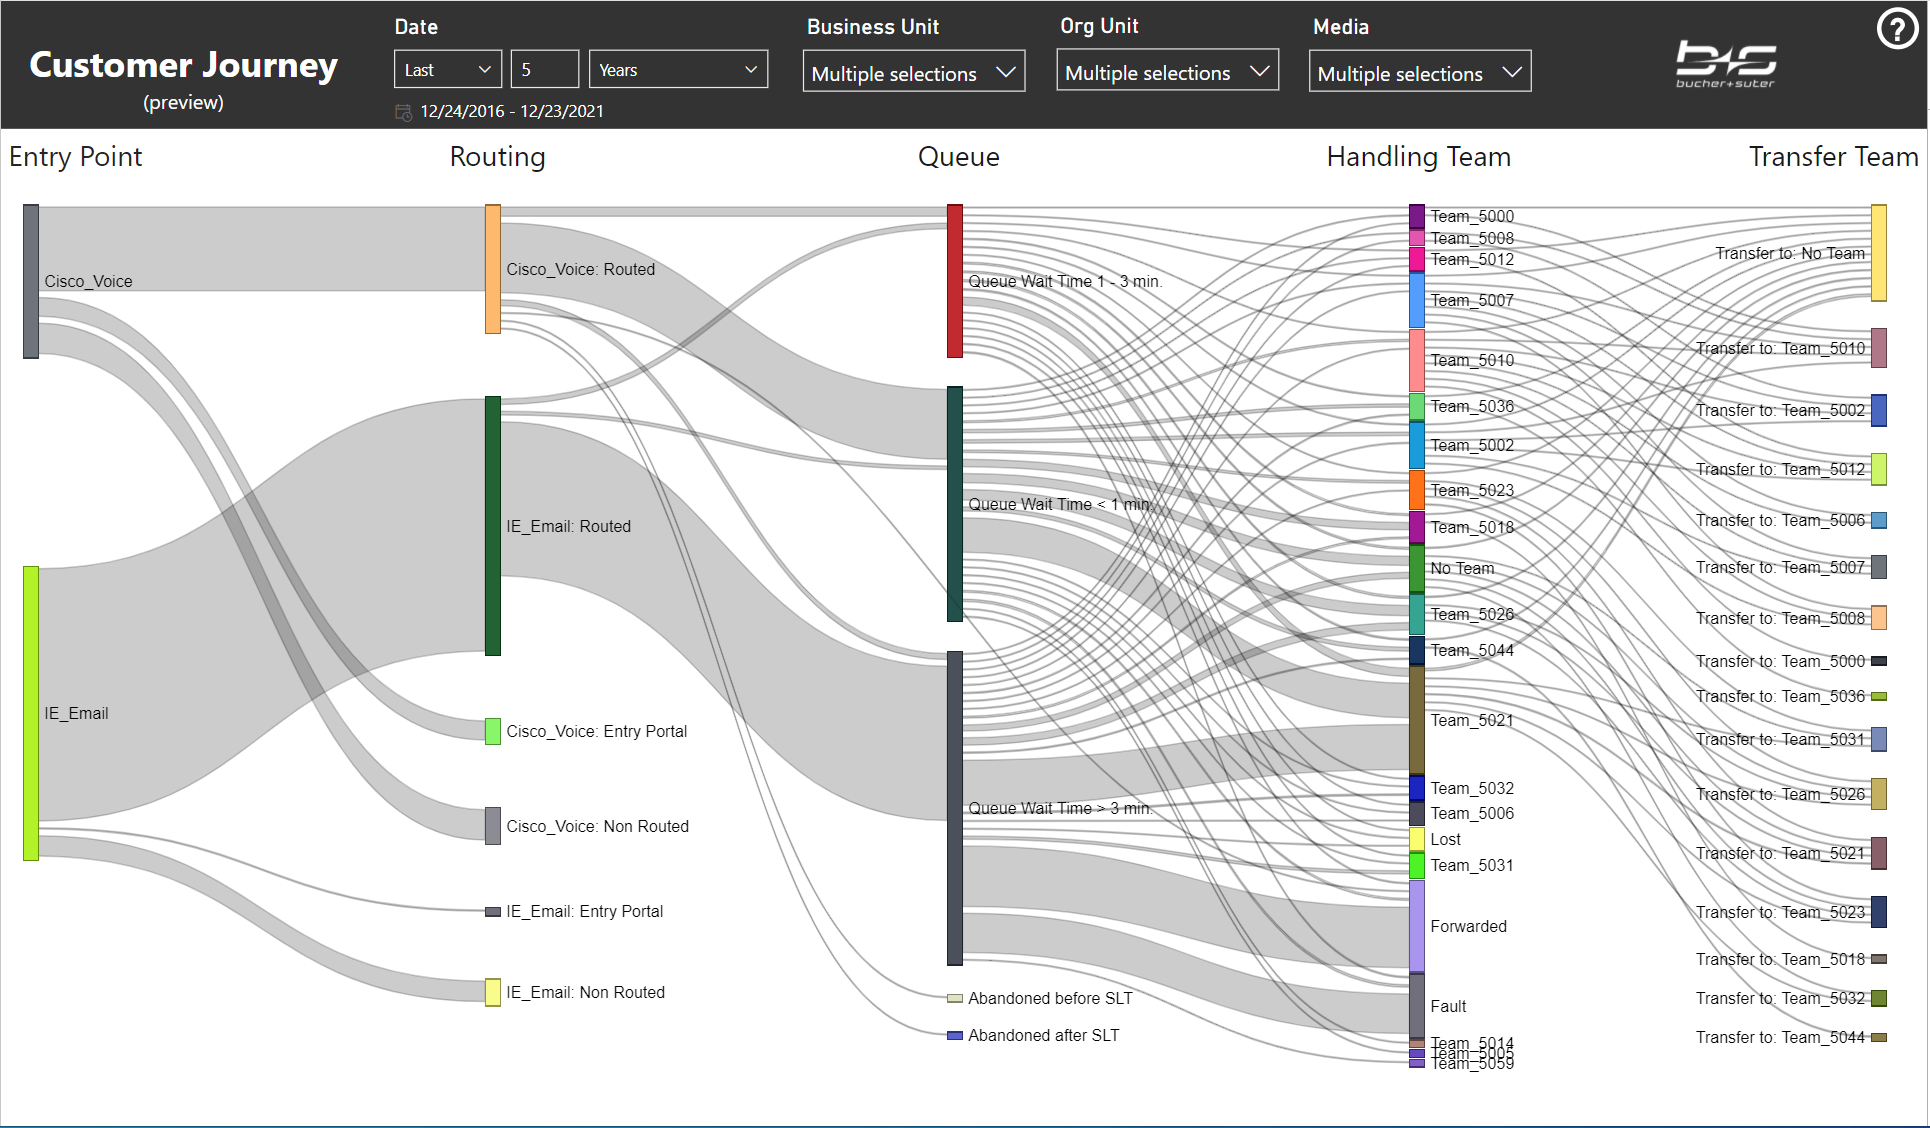
This report relates to a specific data aggregation of certain points within the Call Flow. It displays the volume of your customer tasks from the Entry Points to the Transfer Targets.
Entry point: Represents the volume per Media channel.
Routing: Separates the volume where no change to a Service Level relevant CallType and no routing happened (Entry Portal – e.g. out of hours), where the change to a Service Level relevant CallType but no routing happened (Non Routed – e.g. routing error) and where the change to a Service Level relevant CallType and also the routing to an agent, queue or forward target happened (Routed).
Queue: Displays the volume based on the answer wait time shorter than 1 min, between 1 – 3 min. and greater than 3 min. and for abandoned calls, the volume before and after the service level threshold.
Handling Team: The agent team, where the task volume was answered (no team if the agents did not belong to a team) or the target/outcome without an agent handling (e.g. Forwarded, Lost, Fault).
Transfer Team: The agent team, where the task volume was transferred to from a previous agent (no team if the target was not an agent or the agents did not belong to a team)
This first draft is in preview state without any configuration options. Any feedback about further requirements or ideas are highly welcome.
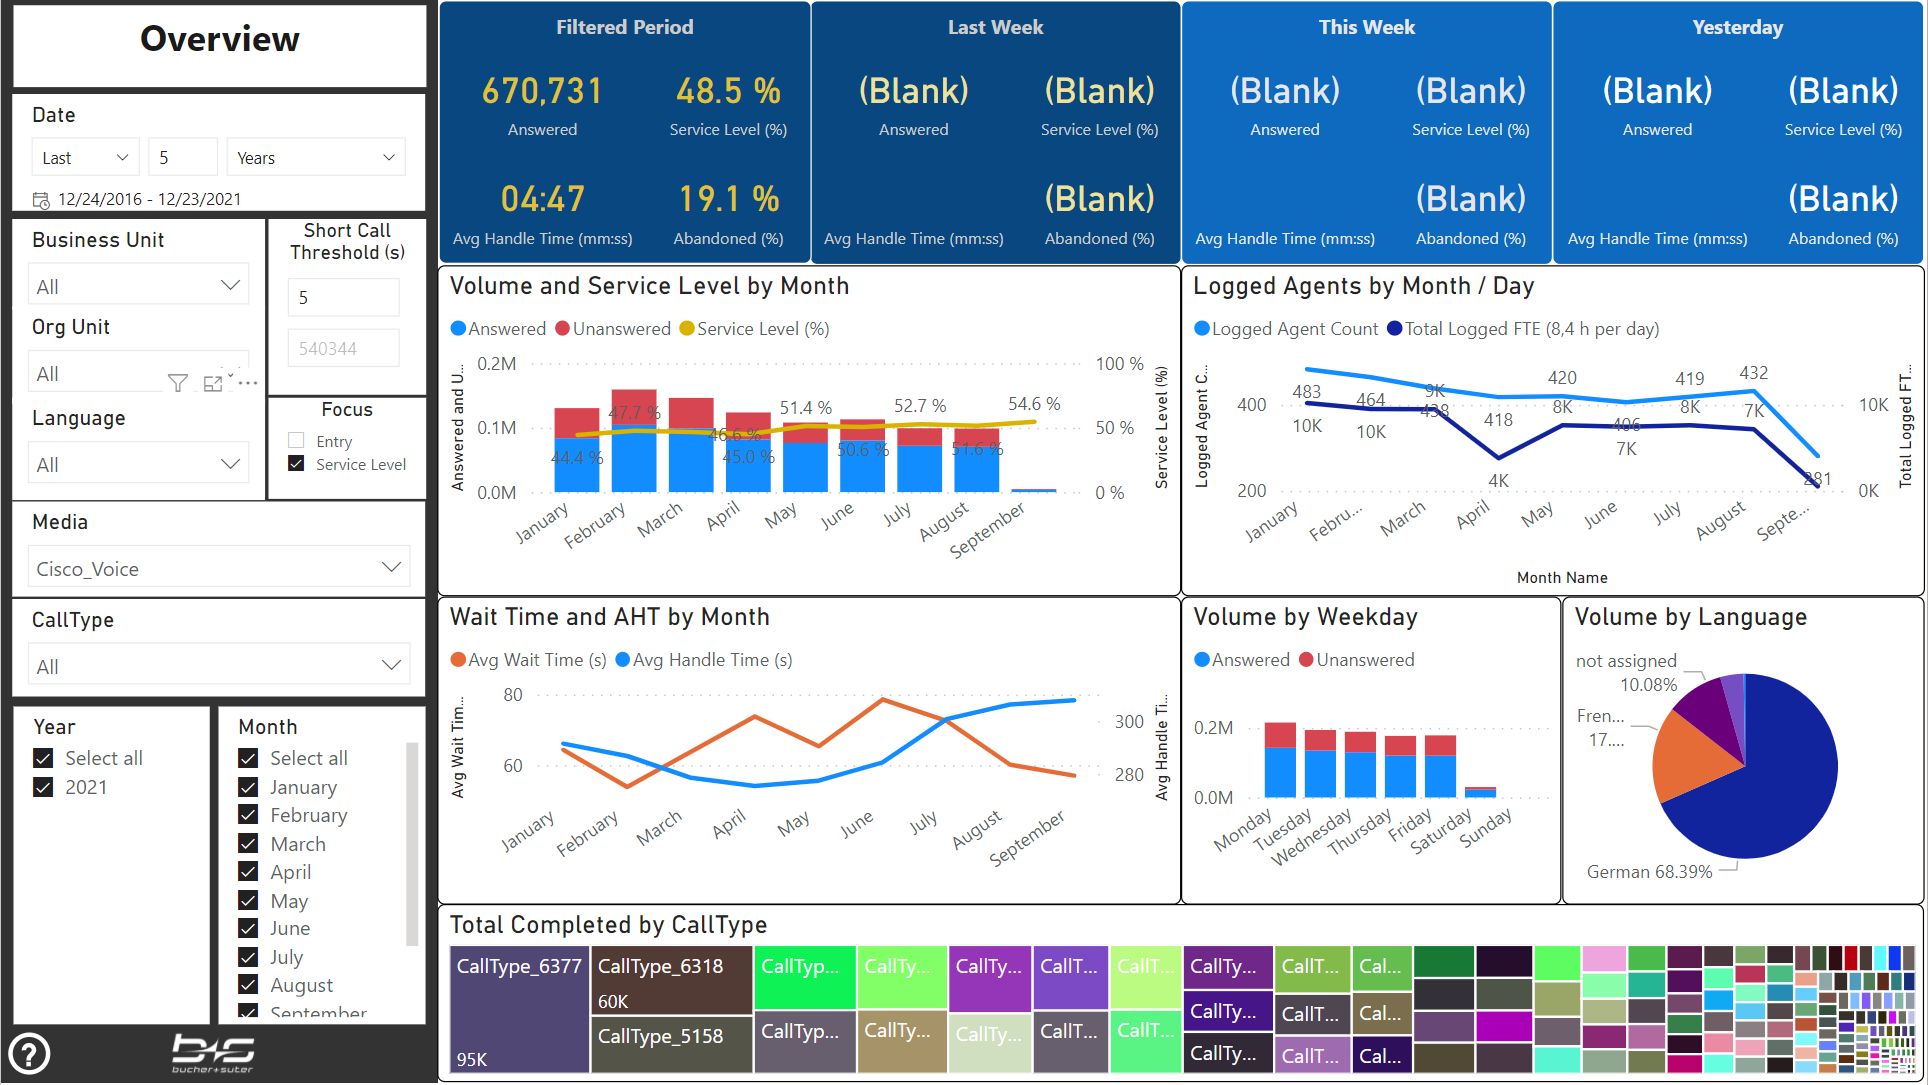
Overview
This report gives you an overview about a certain area within your Contact Center for a shorter period.
It can be used as the first page for specific users and contains the main slicer (filter) page.
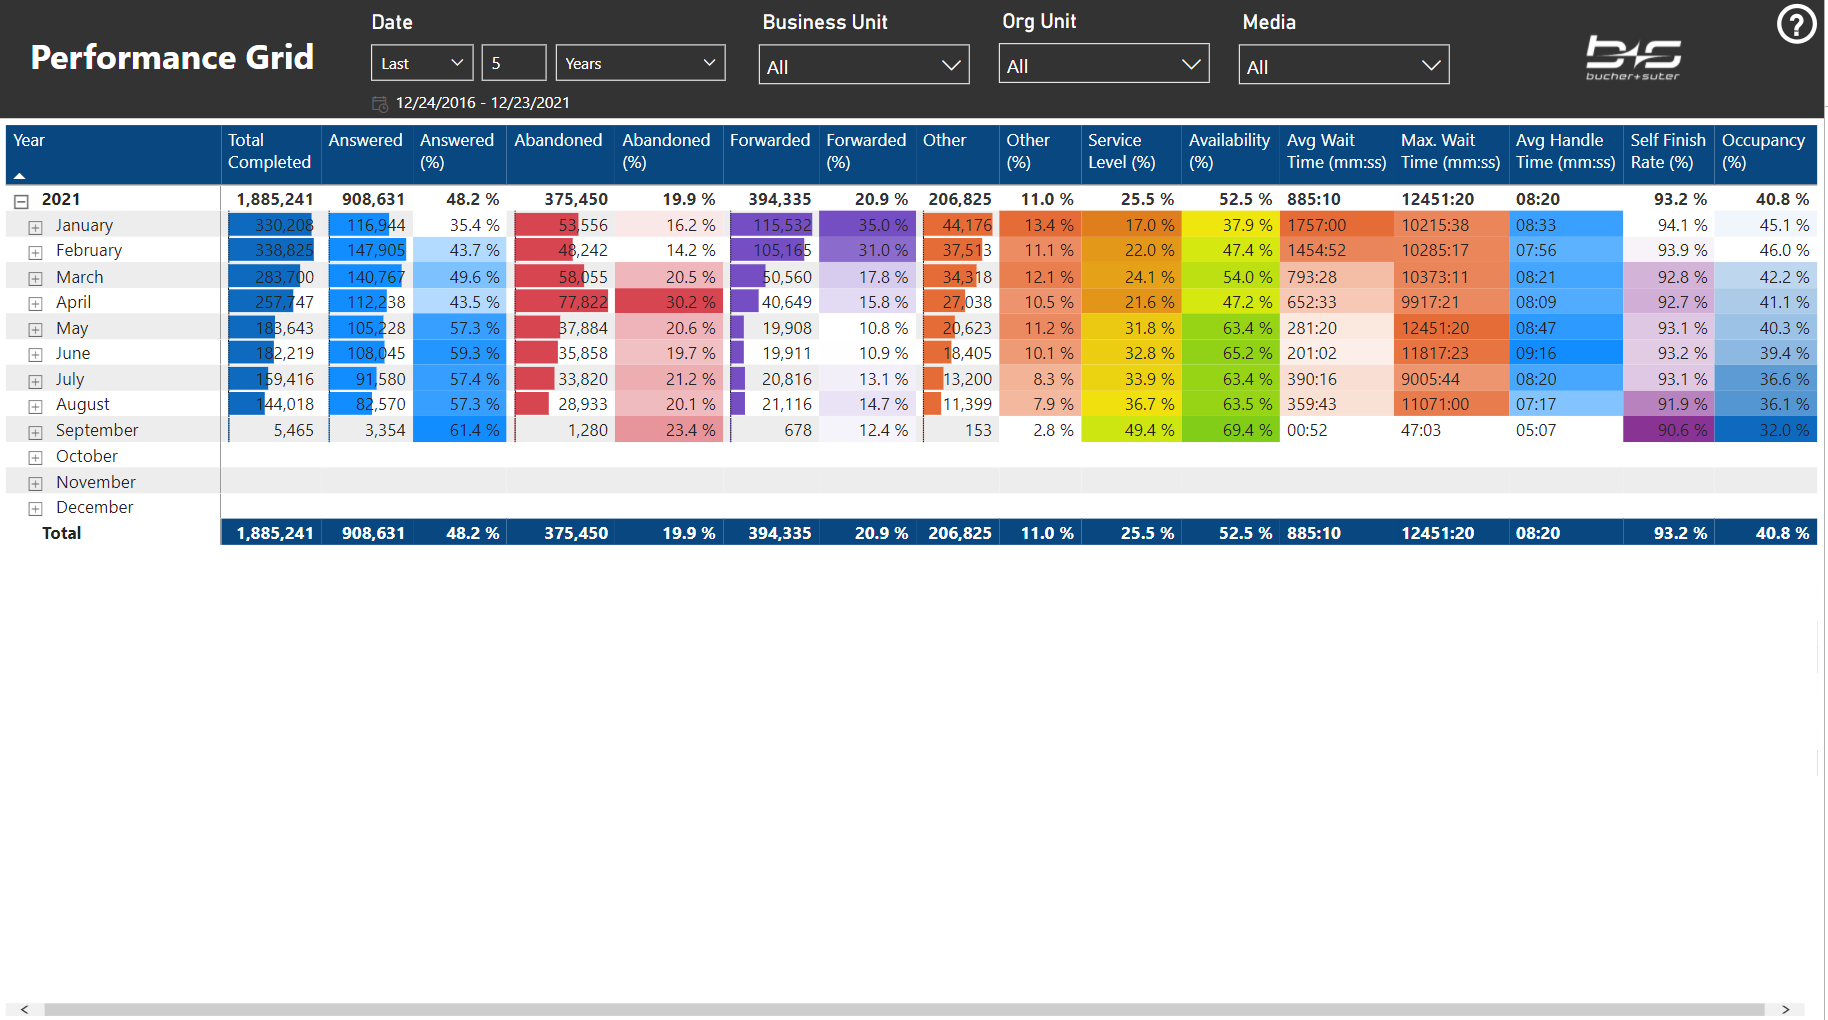
Performance Grid
Use this report to see the available measures in a tabular format including some groupings and conditional formatting.
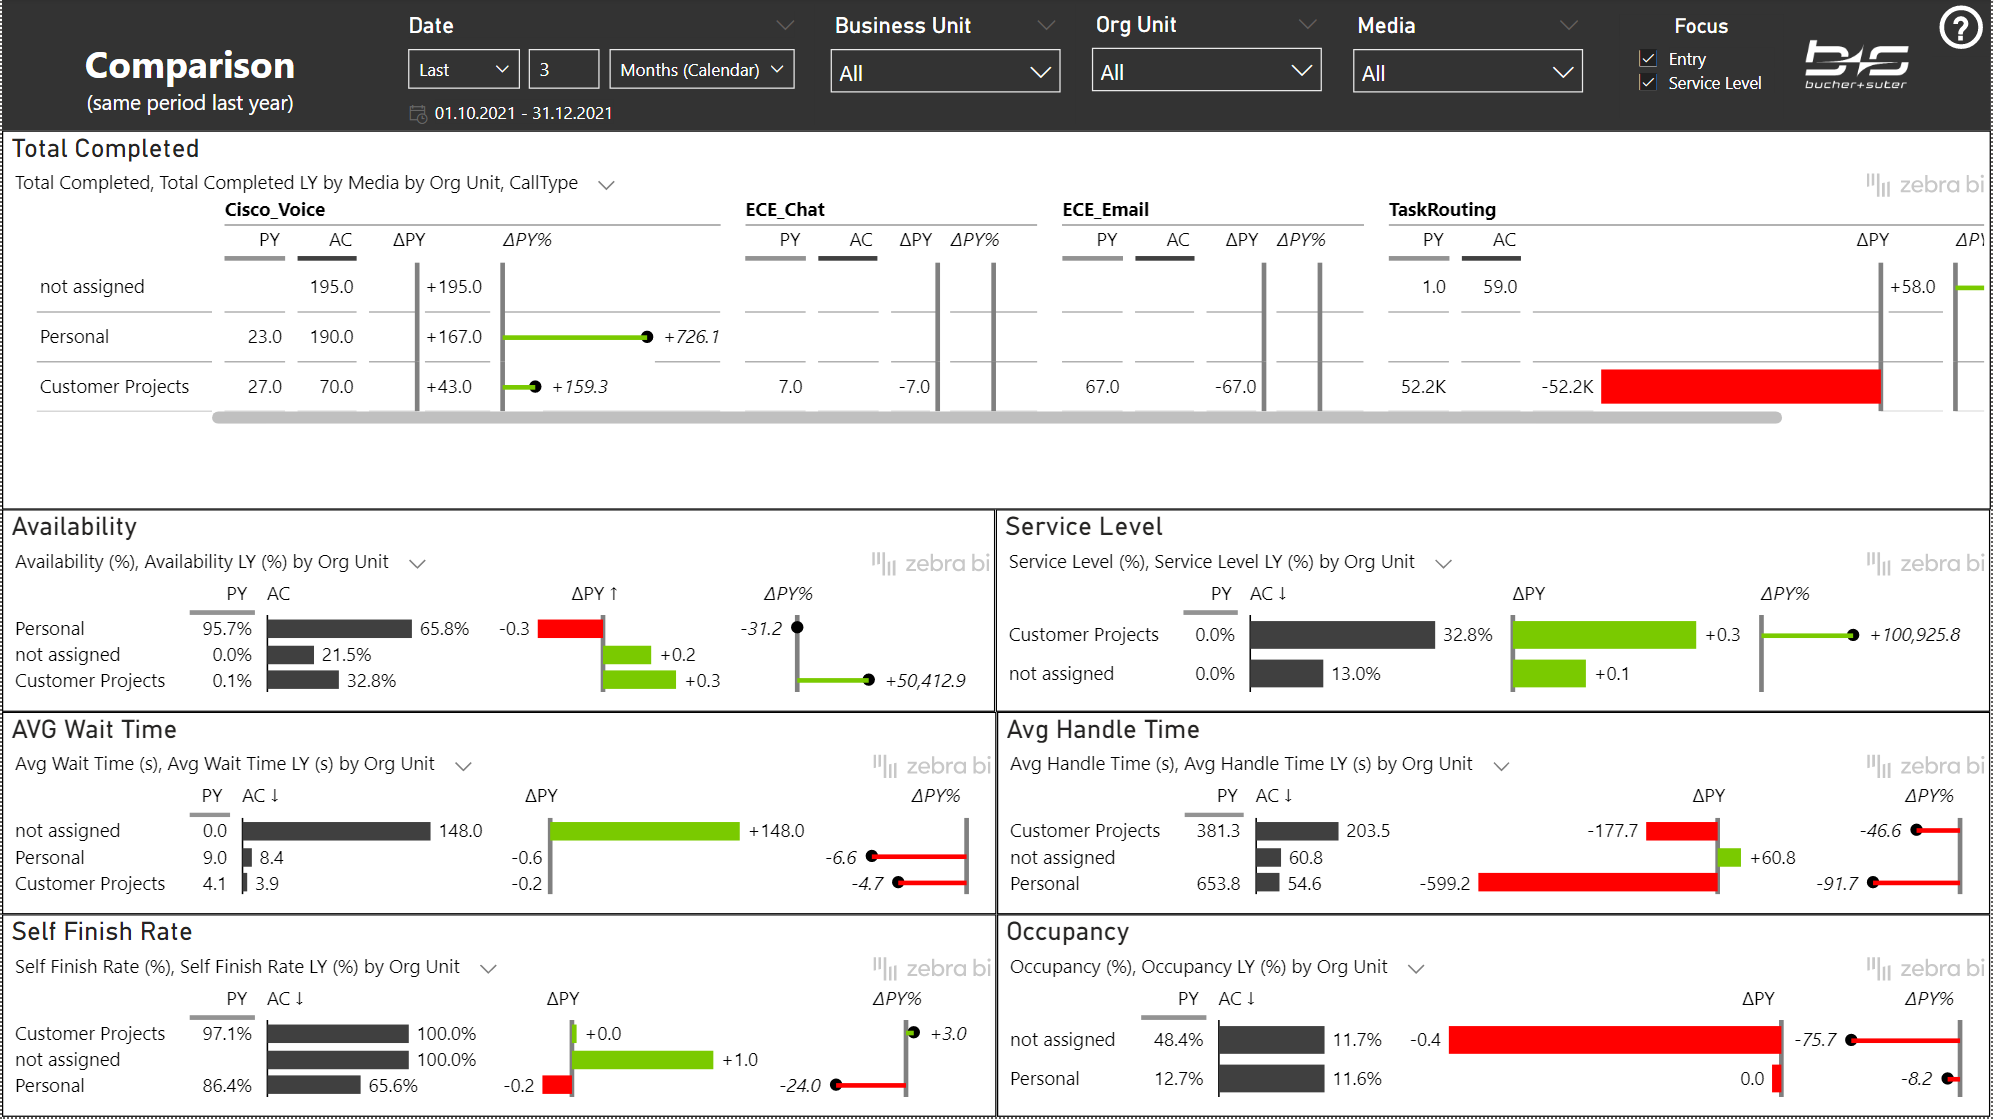
LY Comparison
This report displays the selected data (AC) compared with data for the same period of the last year (PY). If the actual data is higher than last year, the differences are displayed positive in green. If the values are smaller, the differences are displayed negative in red.
Wait time and handle time reductions are positive trends but the differences negatively displayed here – so be careful to read the differences correctly.
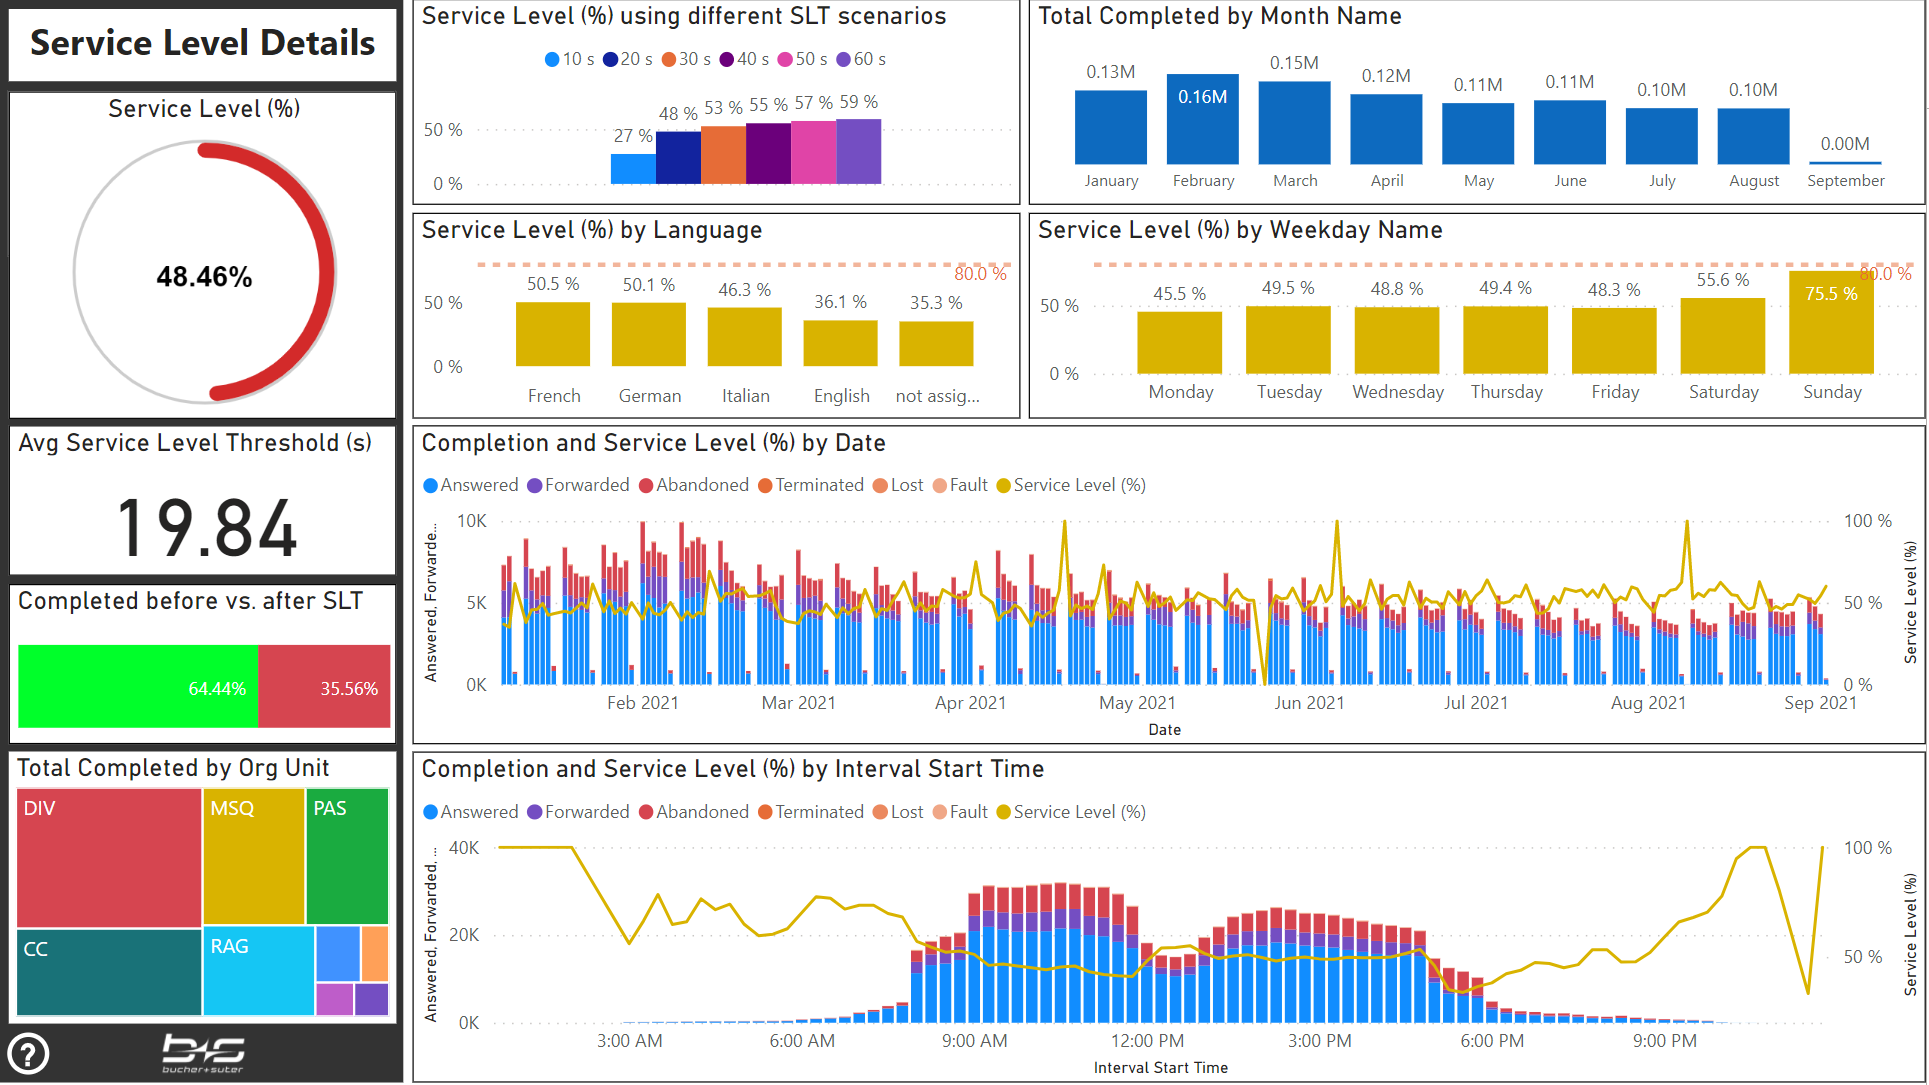
Service Level Details
This report helps you to investigate on the main drivers that affects your Service Level.
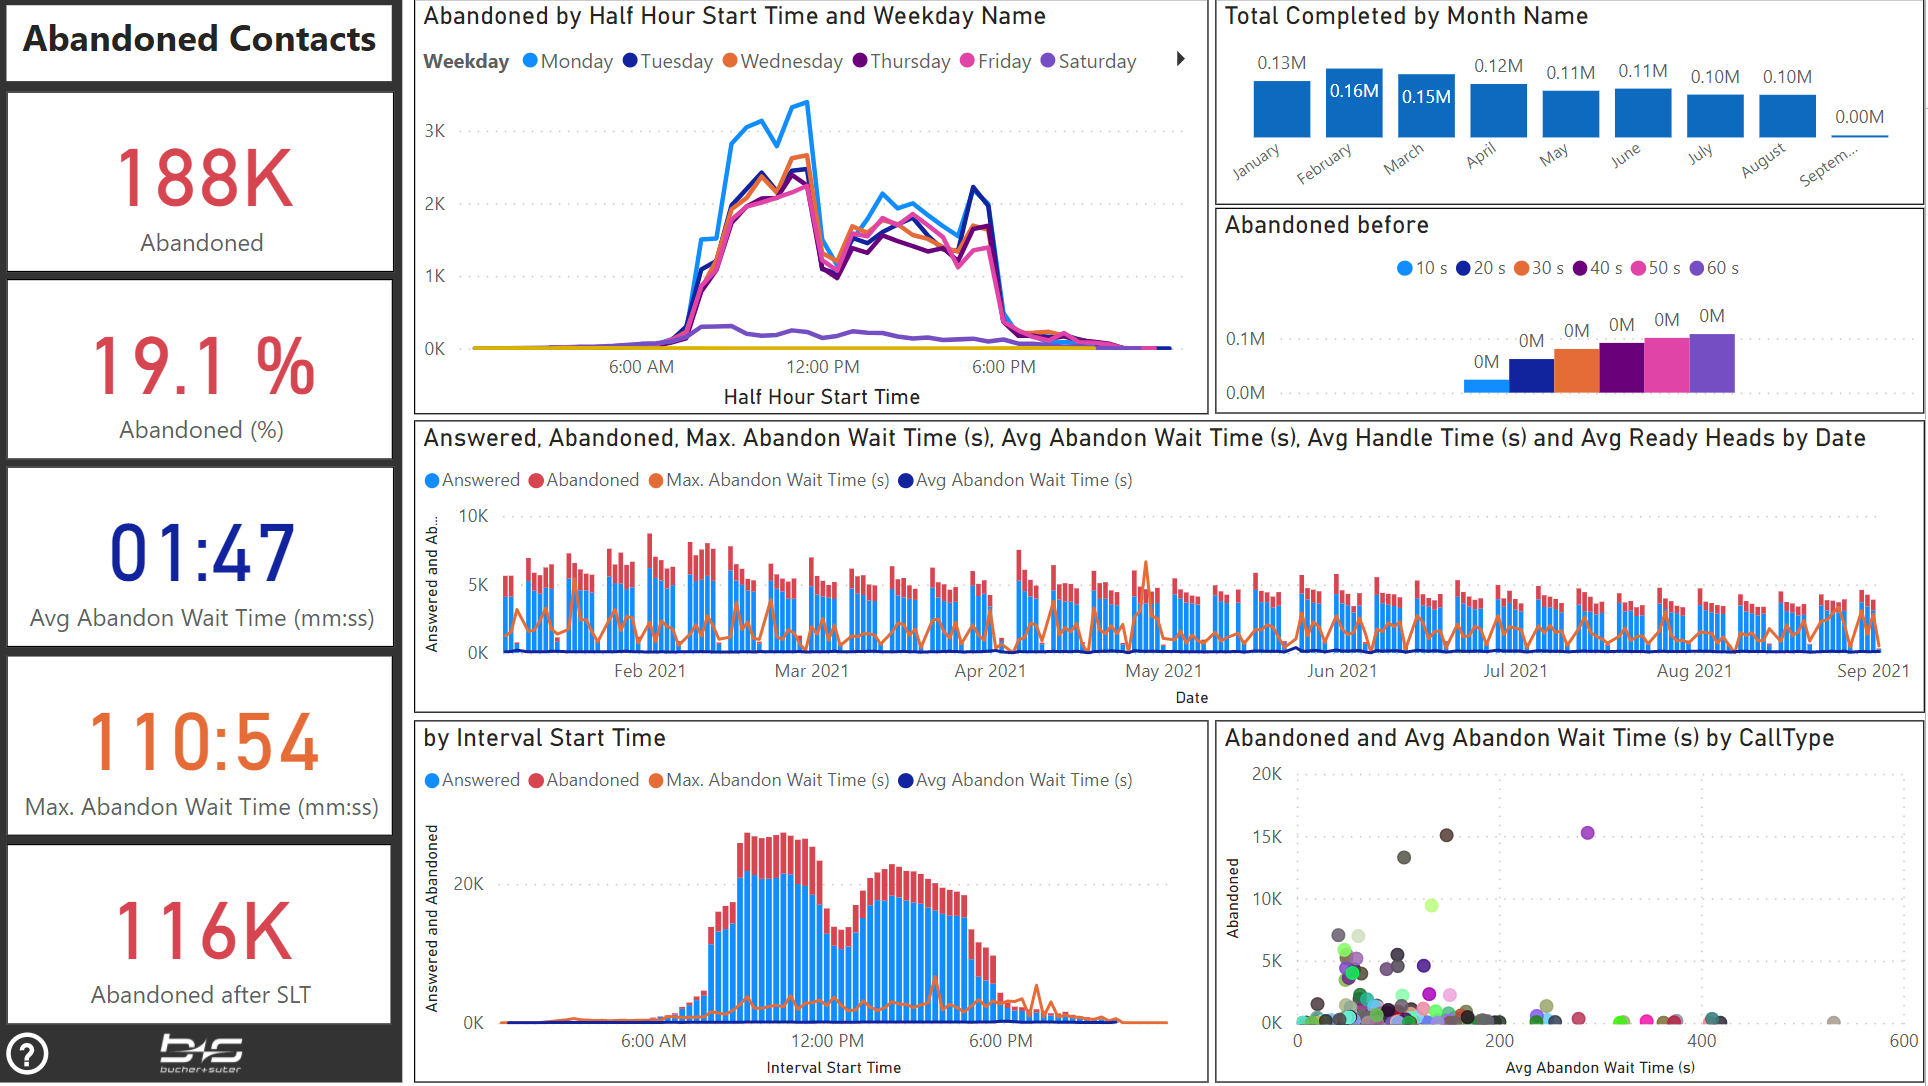
Abandonements
This report helps you to analyze your abandoned contacts and to find the reasons and areas where you could improve.
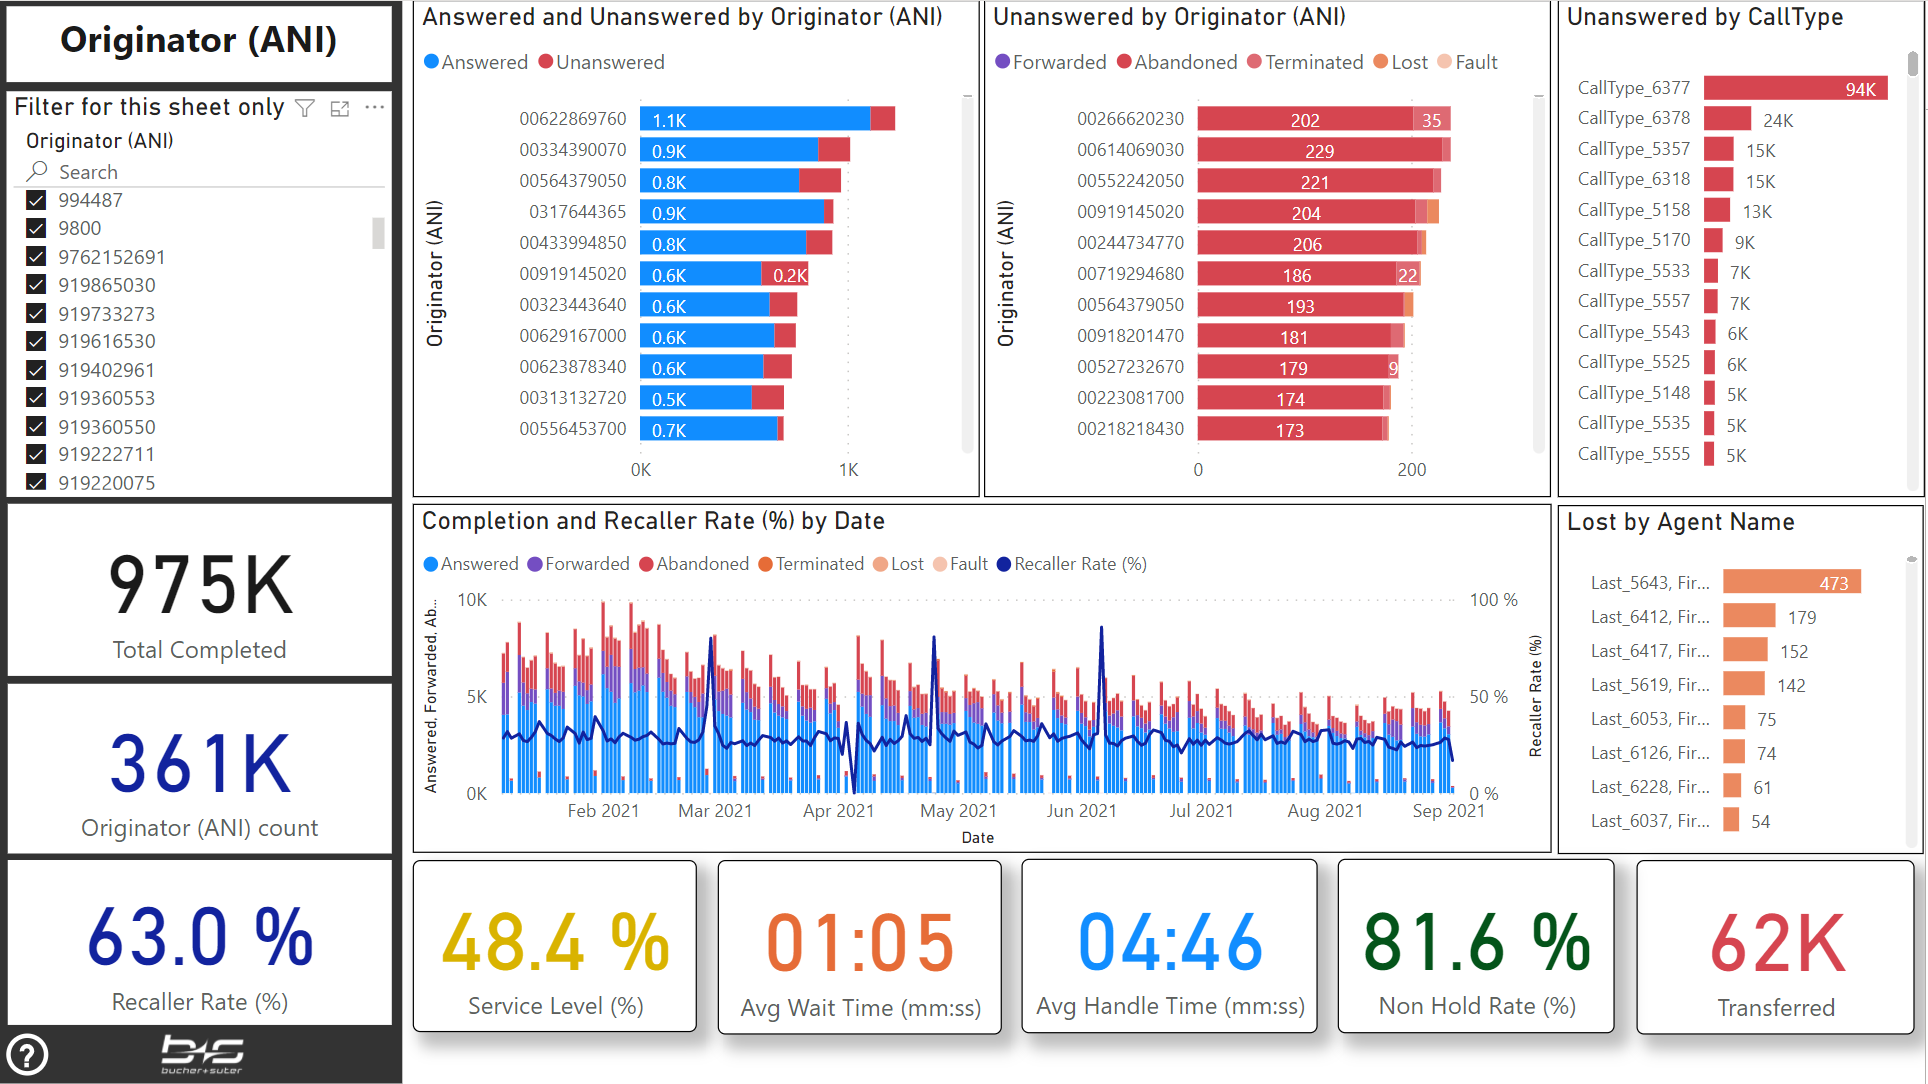
Originator & Recaller
This report displays all your inbound contacts based on the customer’s phone number or email address. It gives you the possibility to see the history, treatment and KPIs by the originators and to investigate the Recaller Rate based on the reason for repeated calls.
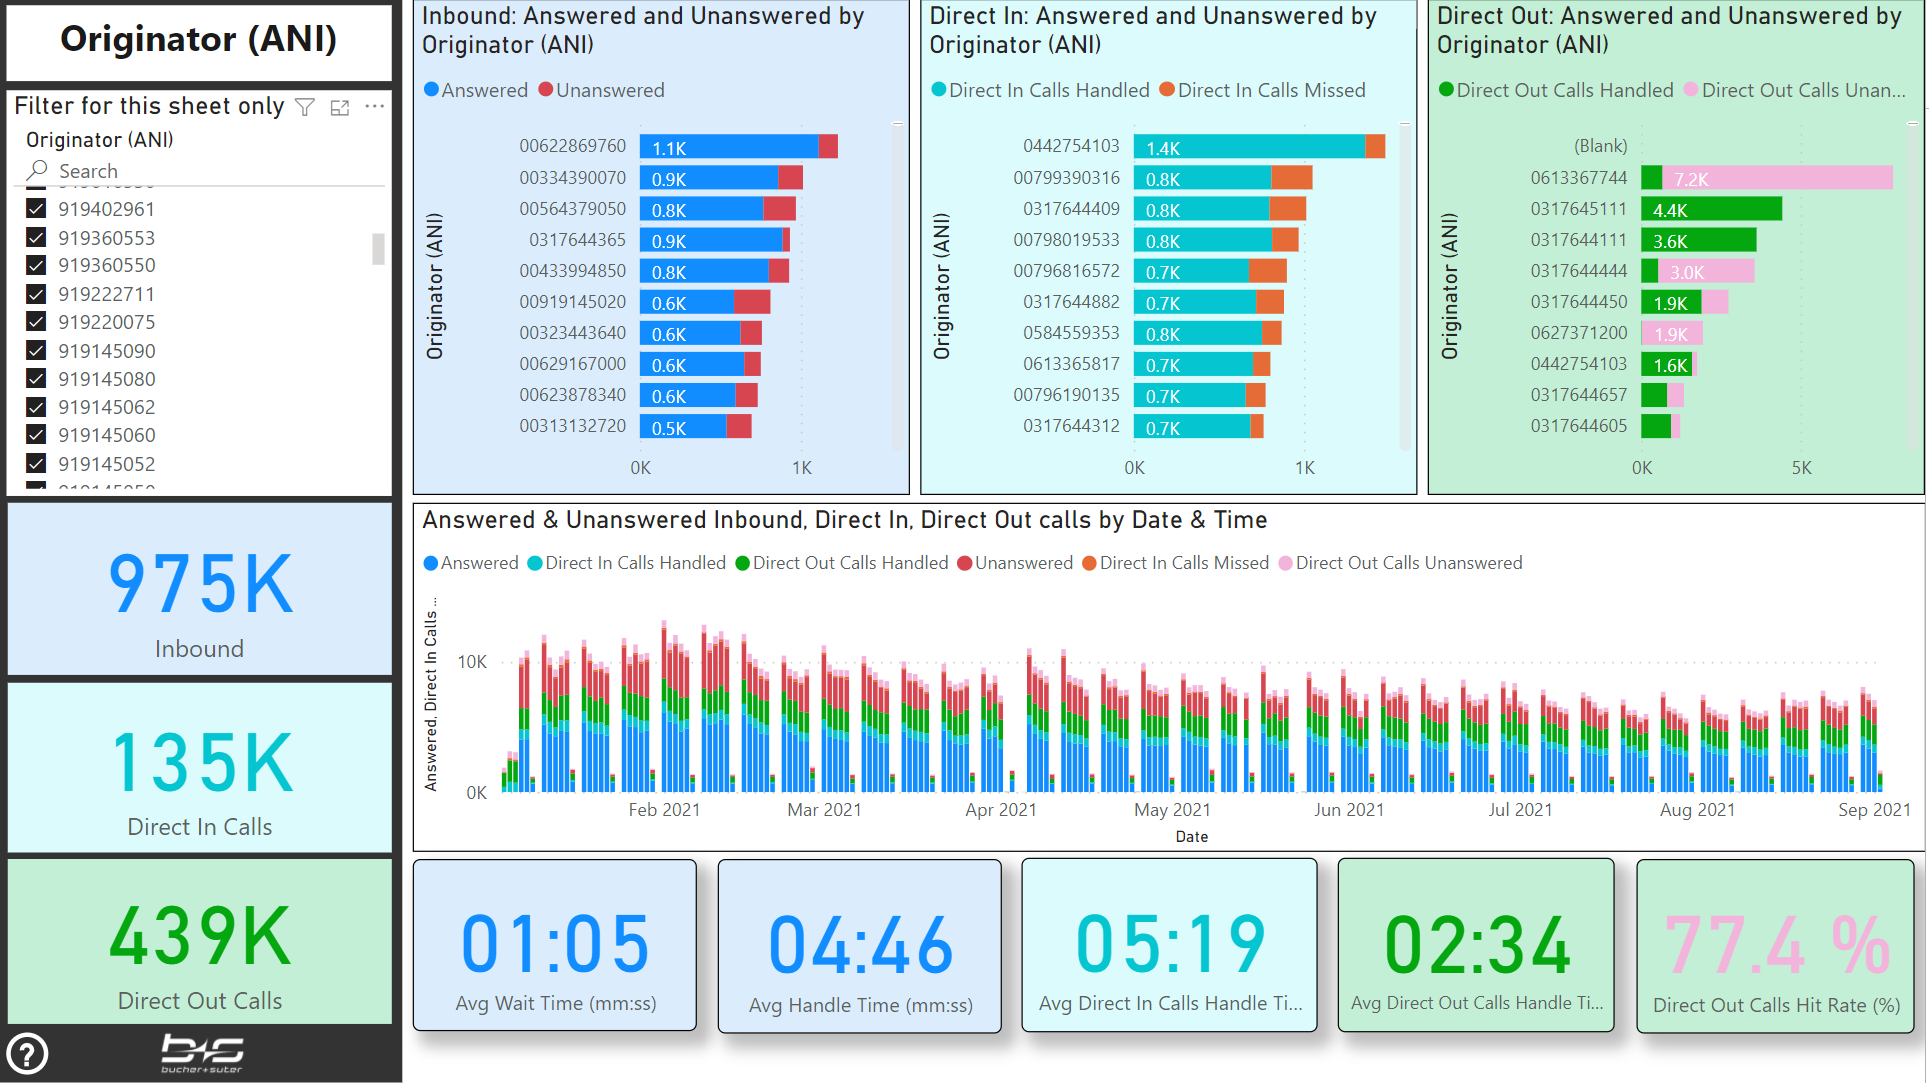
All Originators
This report displays all your inbound contacts and direct calls based on the customer's phone number or email address. It gives you the possibility to see the history, treatment and duration by the originators and its channel (Inbound, Direct In, Direct Out).
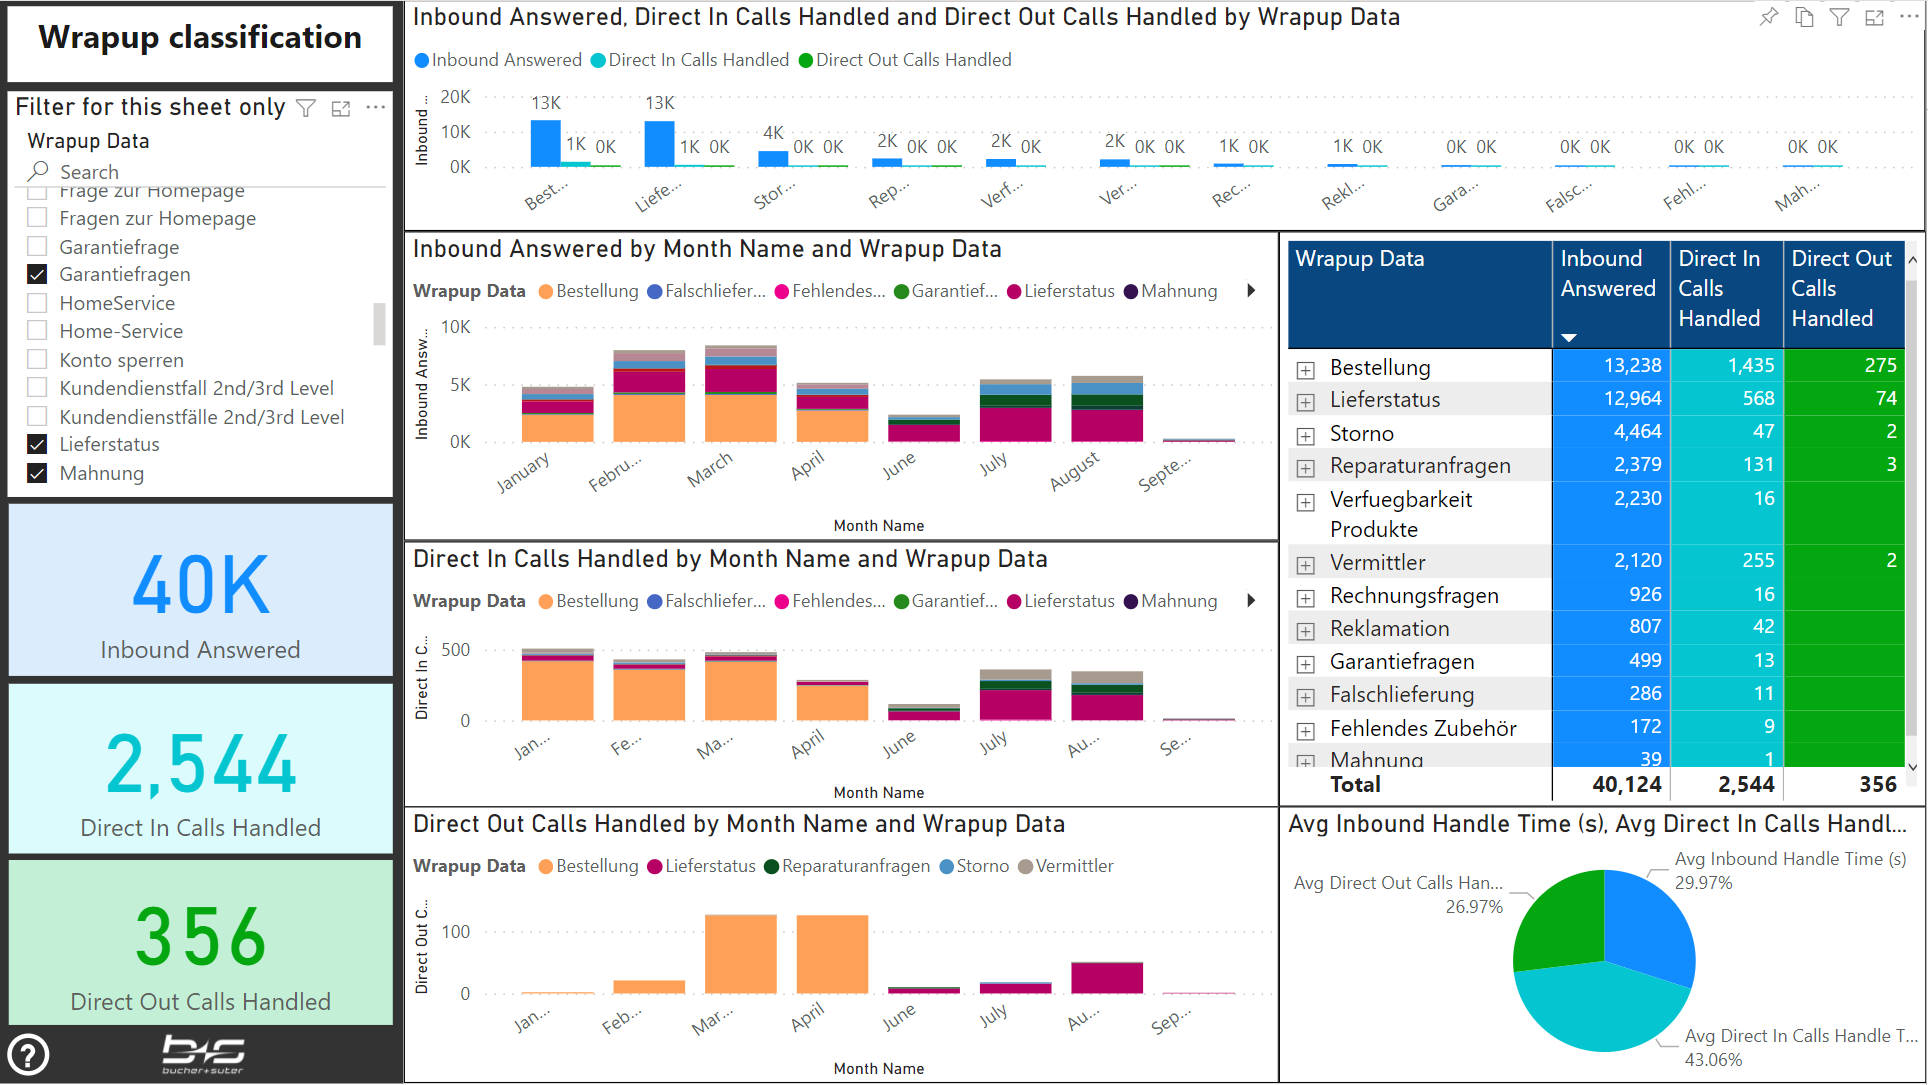
Wrapup classification
This report displays the volume and duration of all your classified contacts by its wrapup data and channel (Inbound, Direct In, Direct Out).
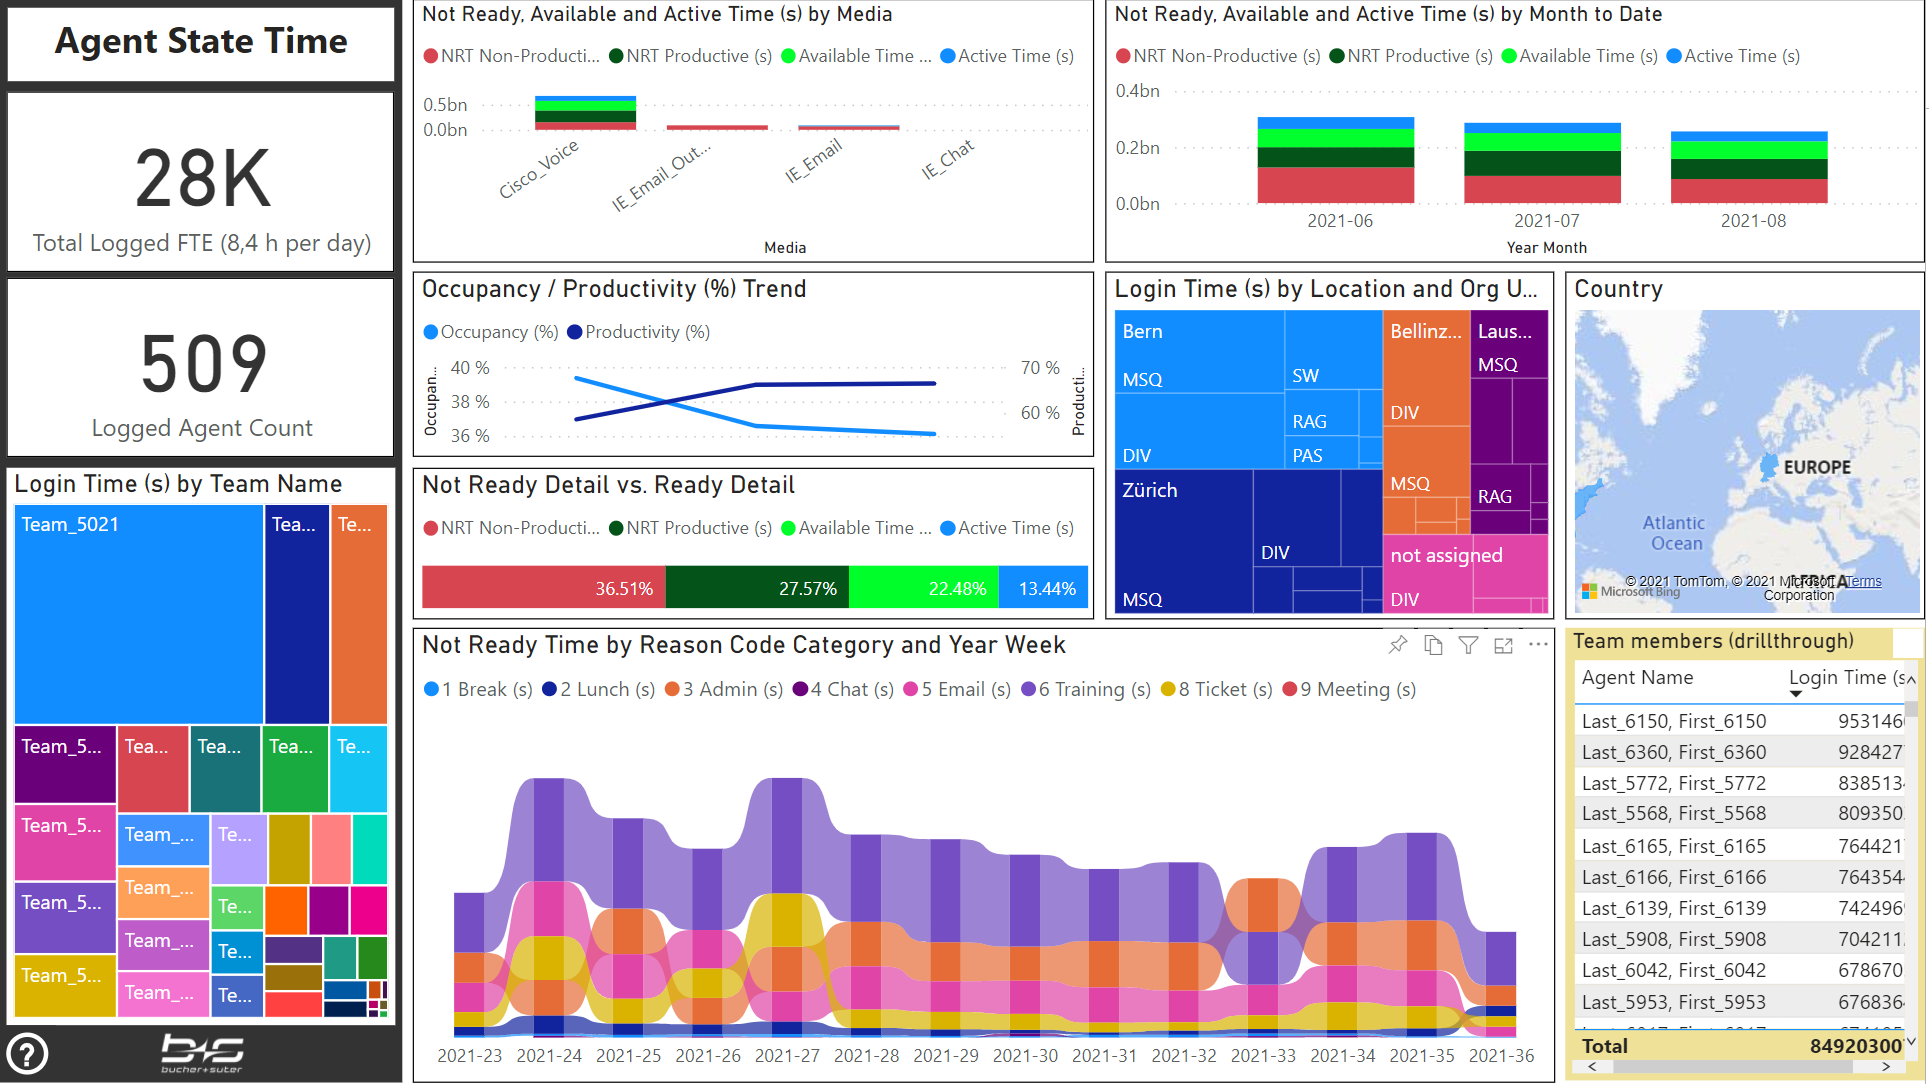
Agent States
This report gives you an overview about your available agents, their occupancy and activities during the not ready stage.
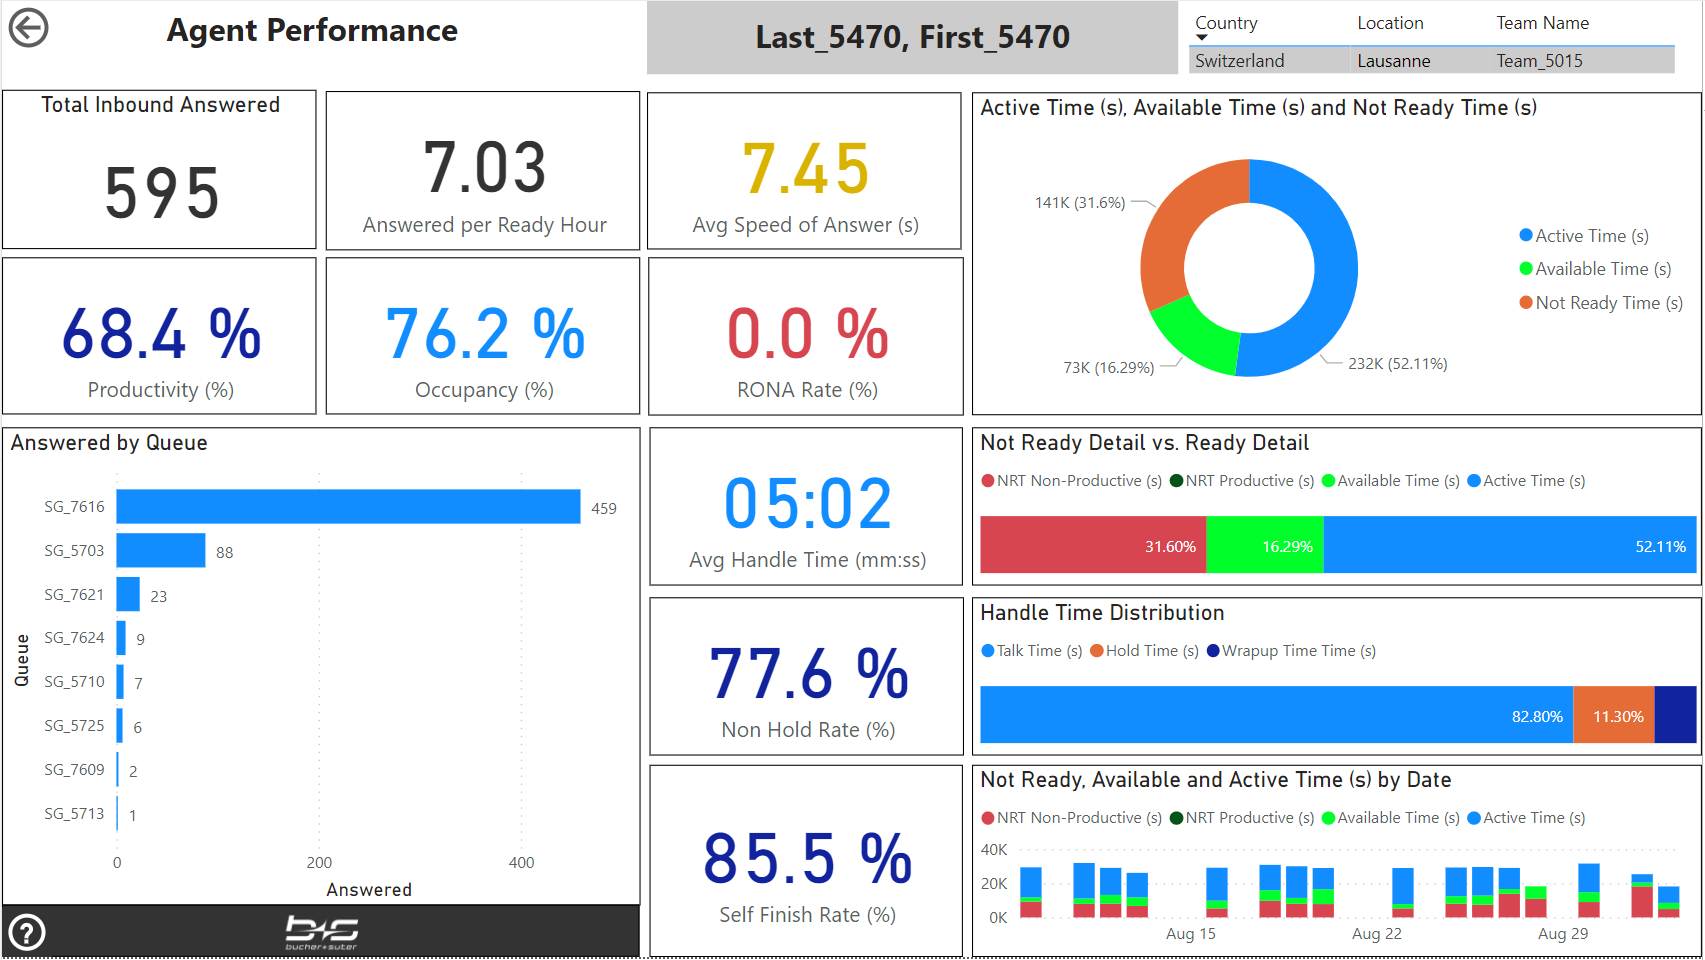
Agent Performance
This report gives you an overview about a single agent, including the inbound handling, some KPIs and the state durations during the login sessions. You can reach this report from the previous report with a right click on the agent list and selecting the drillthrough to this report.
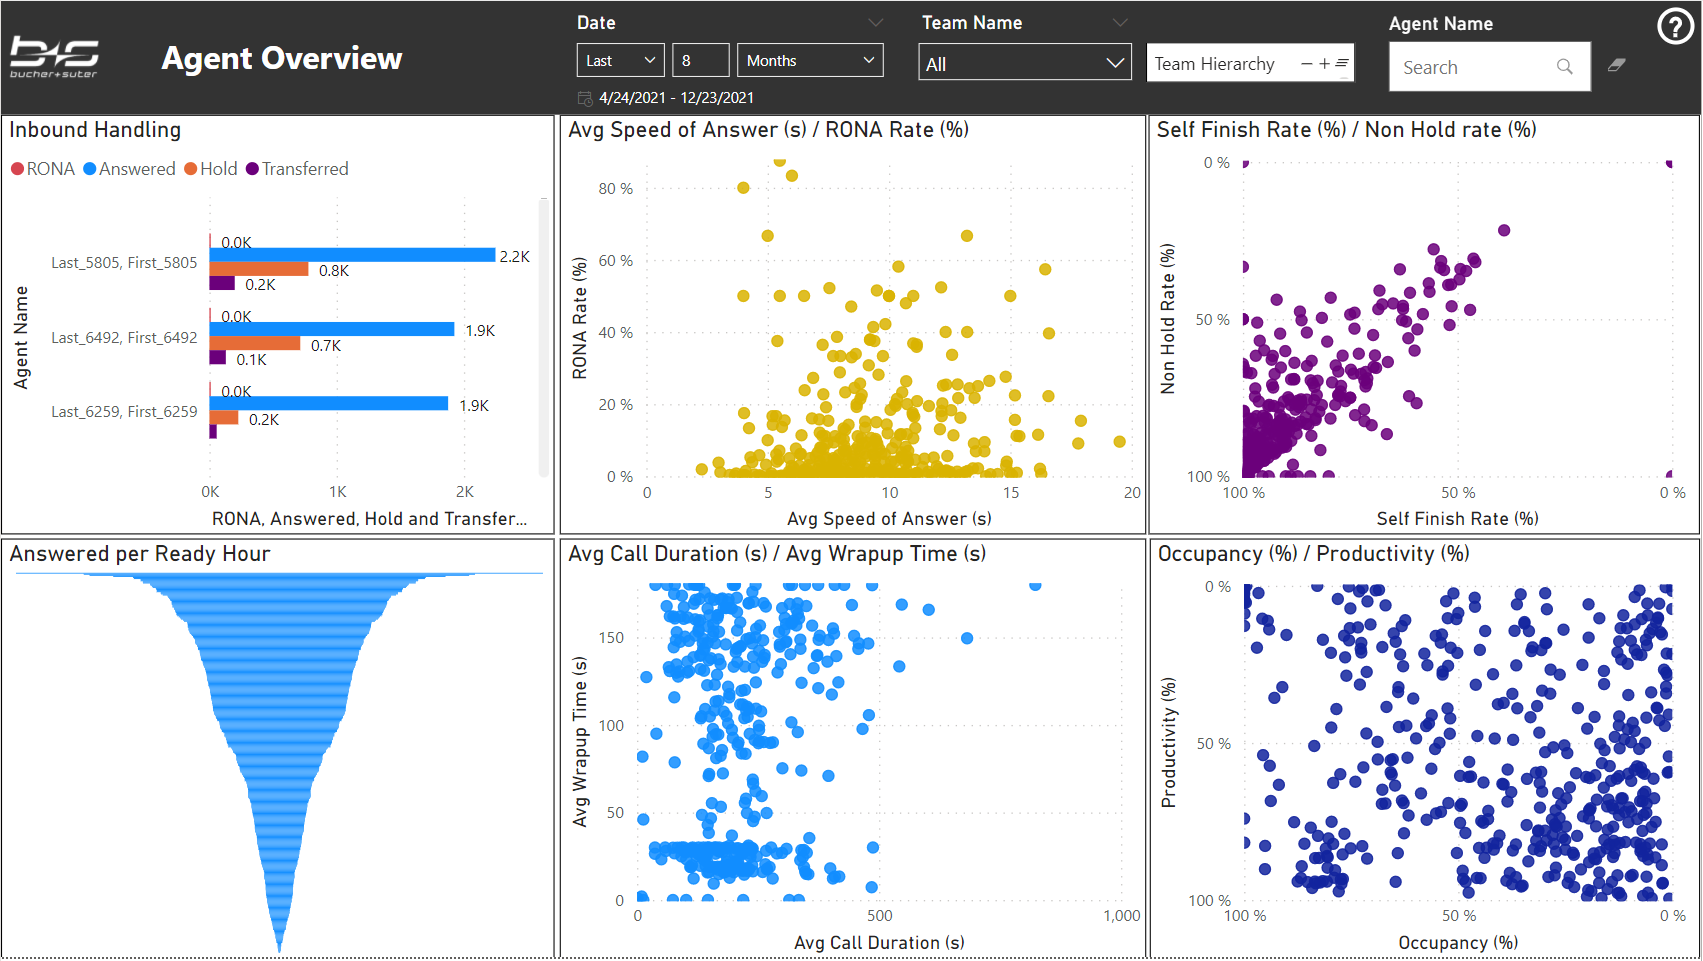
Agent Overview
This report provides an overview about the agent KPIs and their distribution.
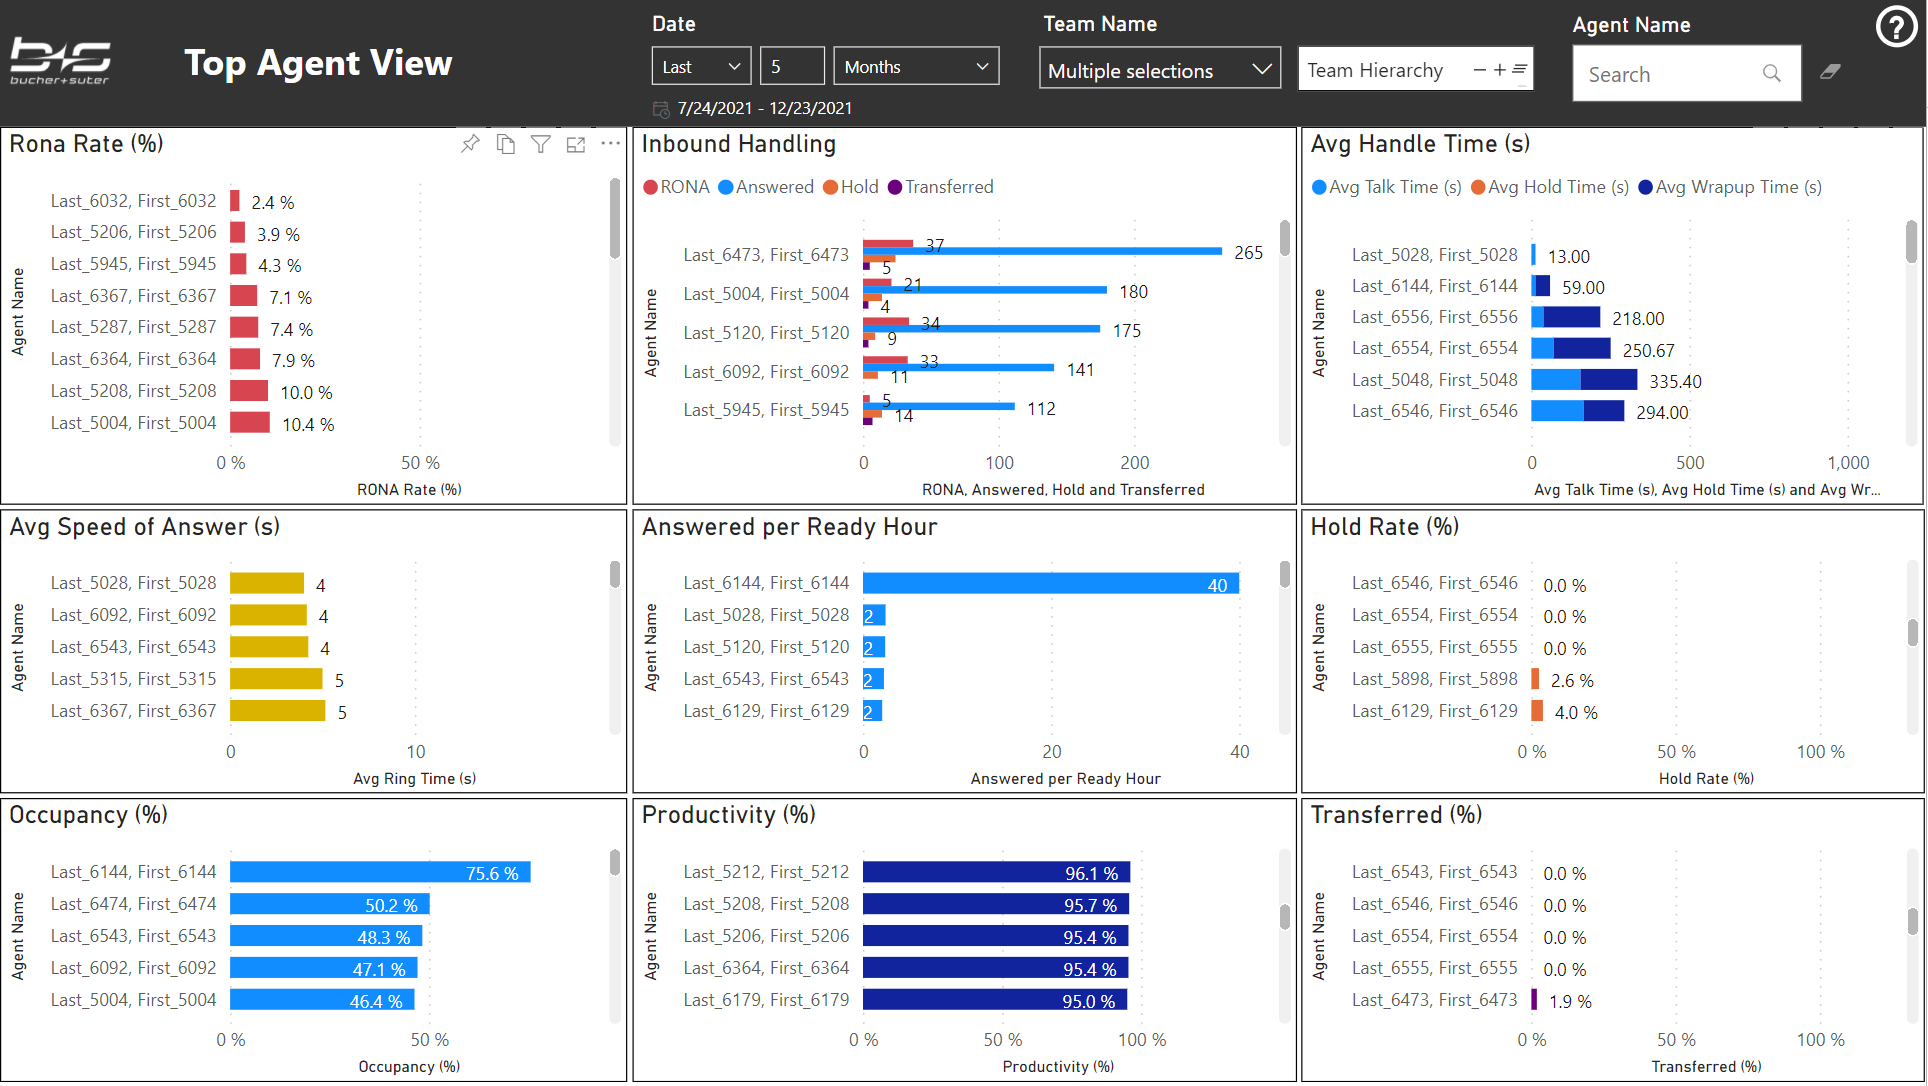
Top Agent View
This report displays the most important agent KPIs listed by agent names with the best agents on top.
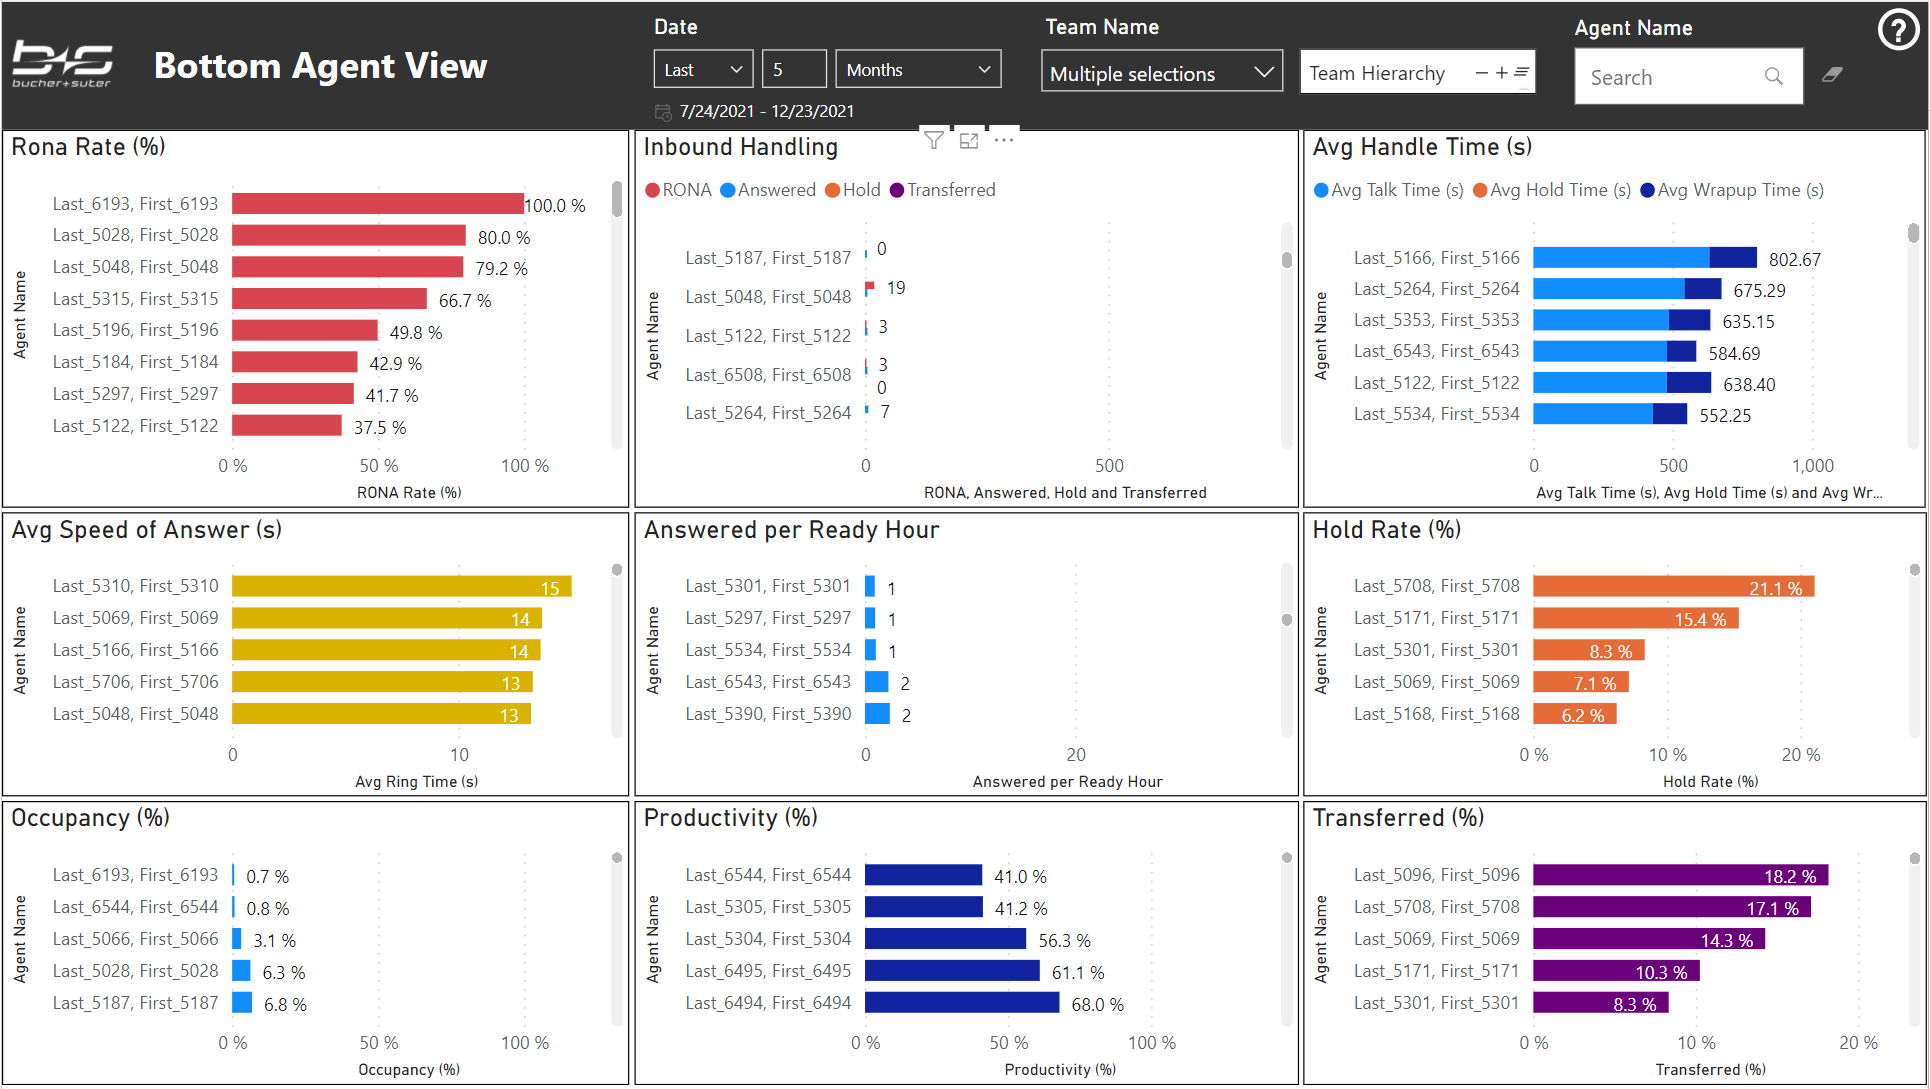
Bottom Agent View
This report displays the most important agent KPIs listed by agent names with the worst agents on top.
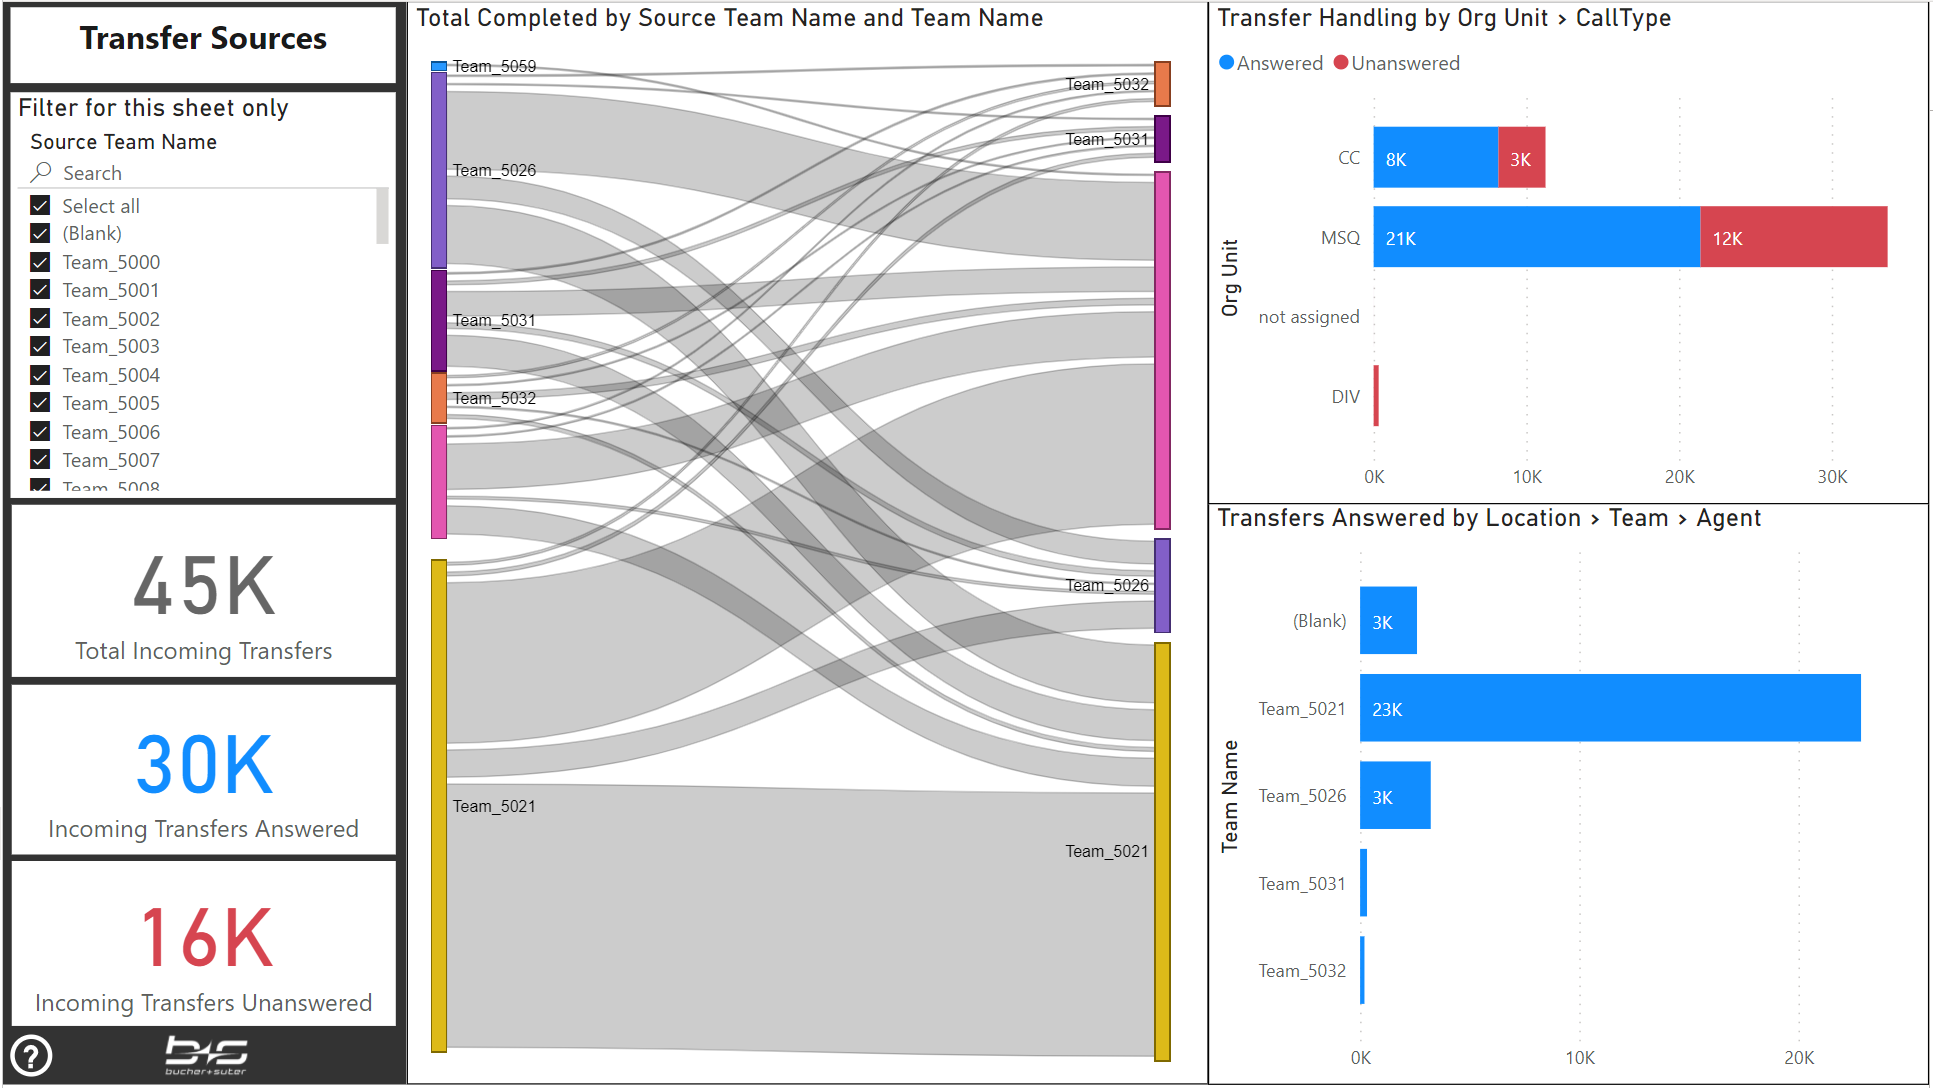
Transfer Sources
This report displays the transferred volume of tasks from previous inbound agents to your services. It also contains the outcome of those specific transferred tasks and from where to where they went.
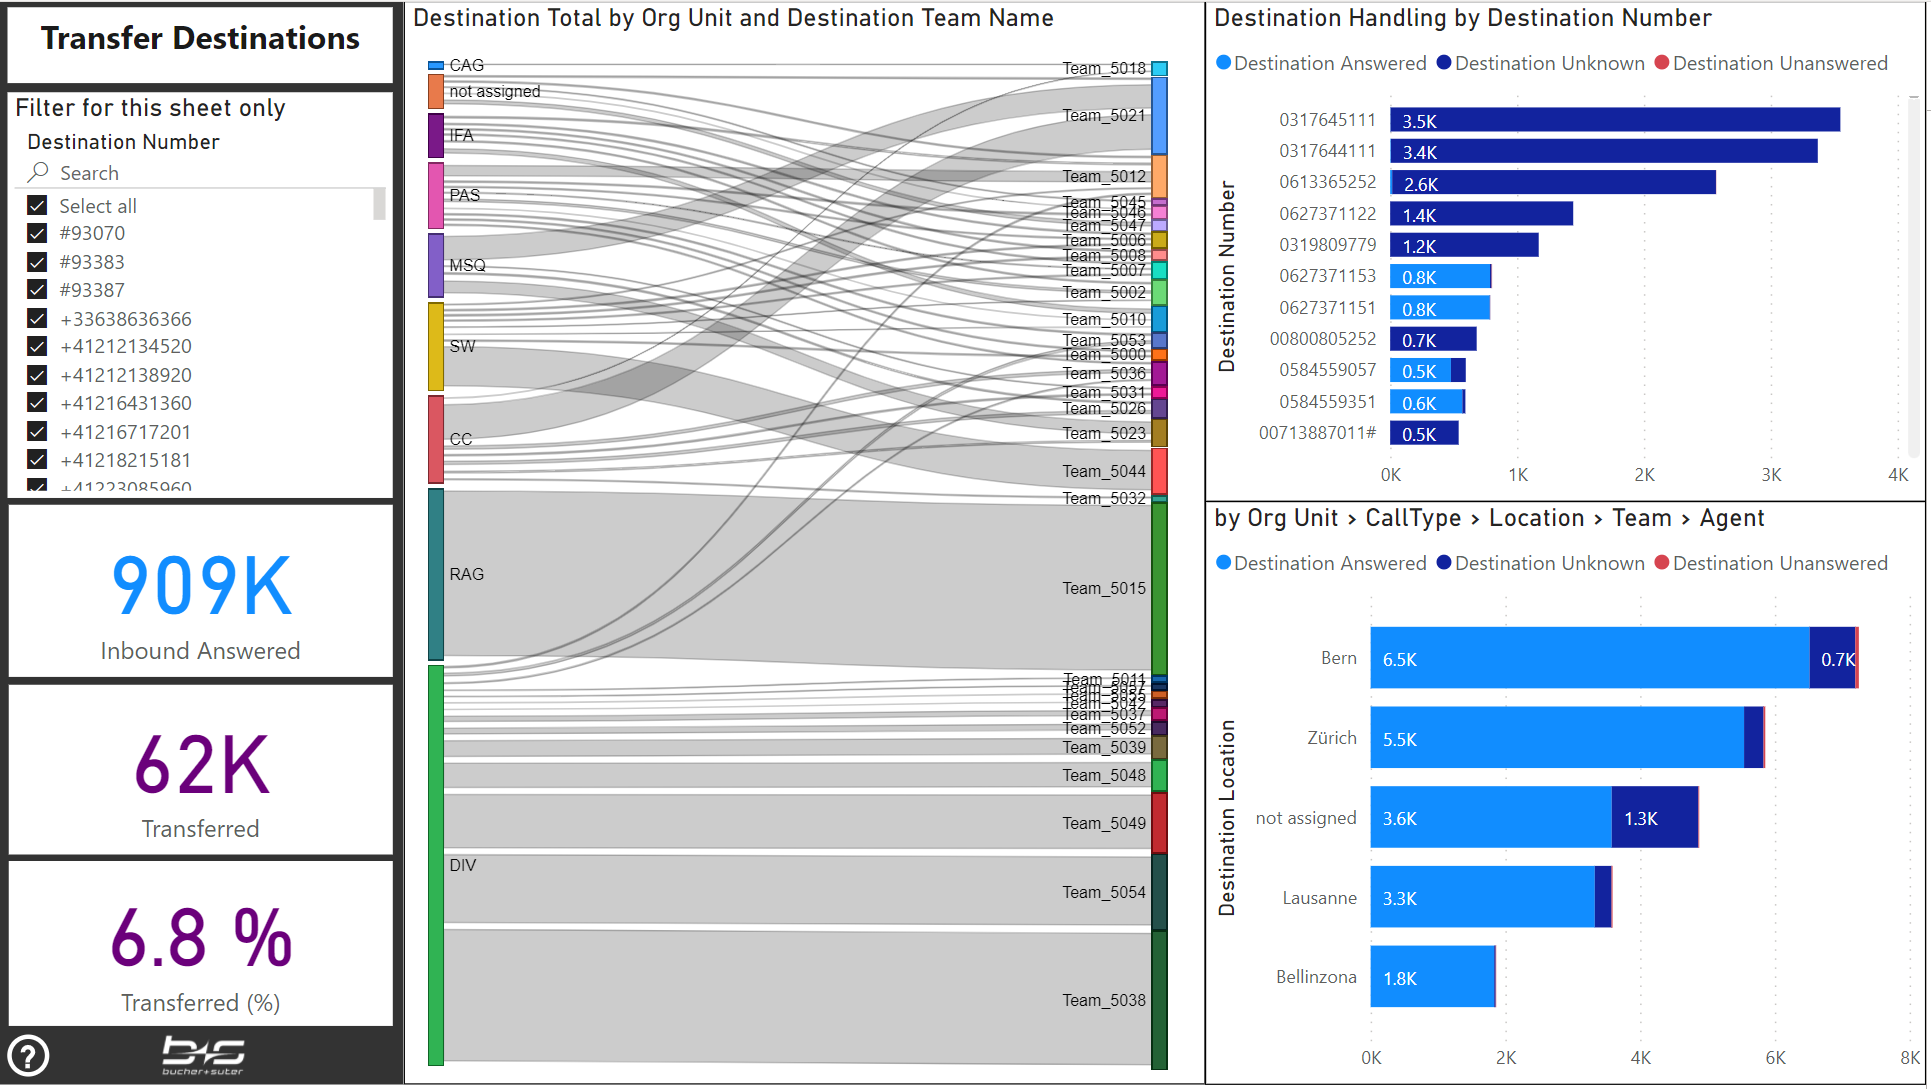
Transfer Destinations
This report displays the transferred volume of tasks of your services to any destination. It also contains the specific targets and the outcome of those transferred tasks, if they went to another agent through a queue or its direct number. Finally, it also displays the path from where to where the transfers went.
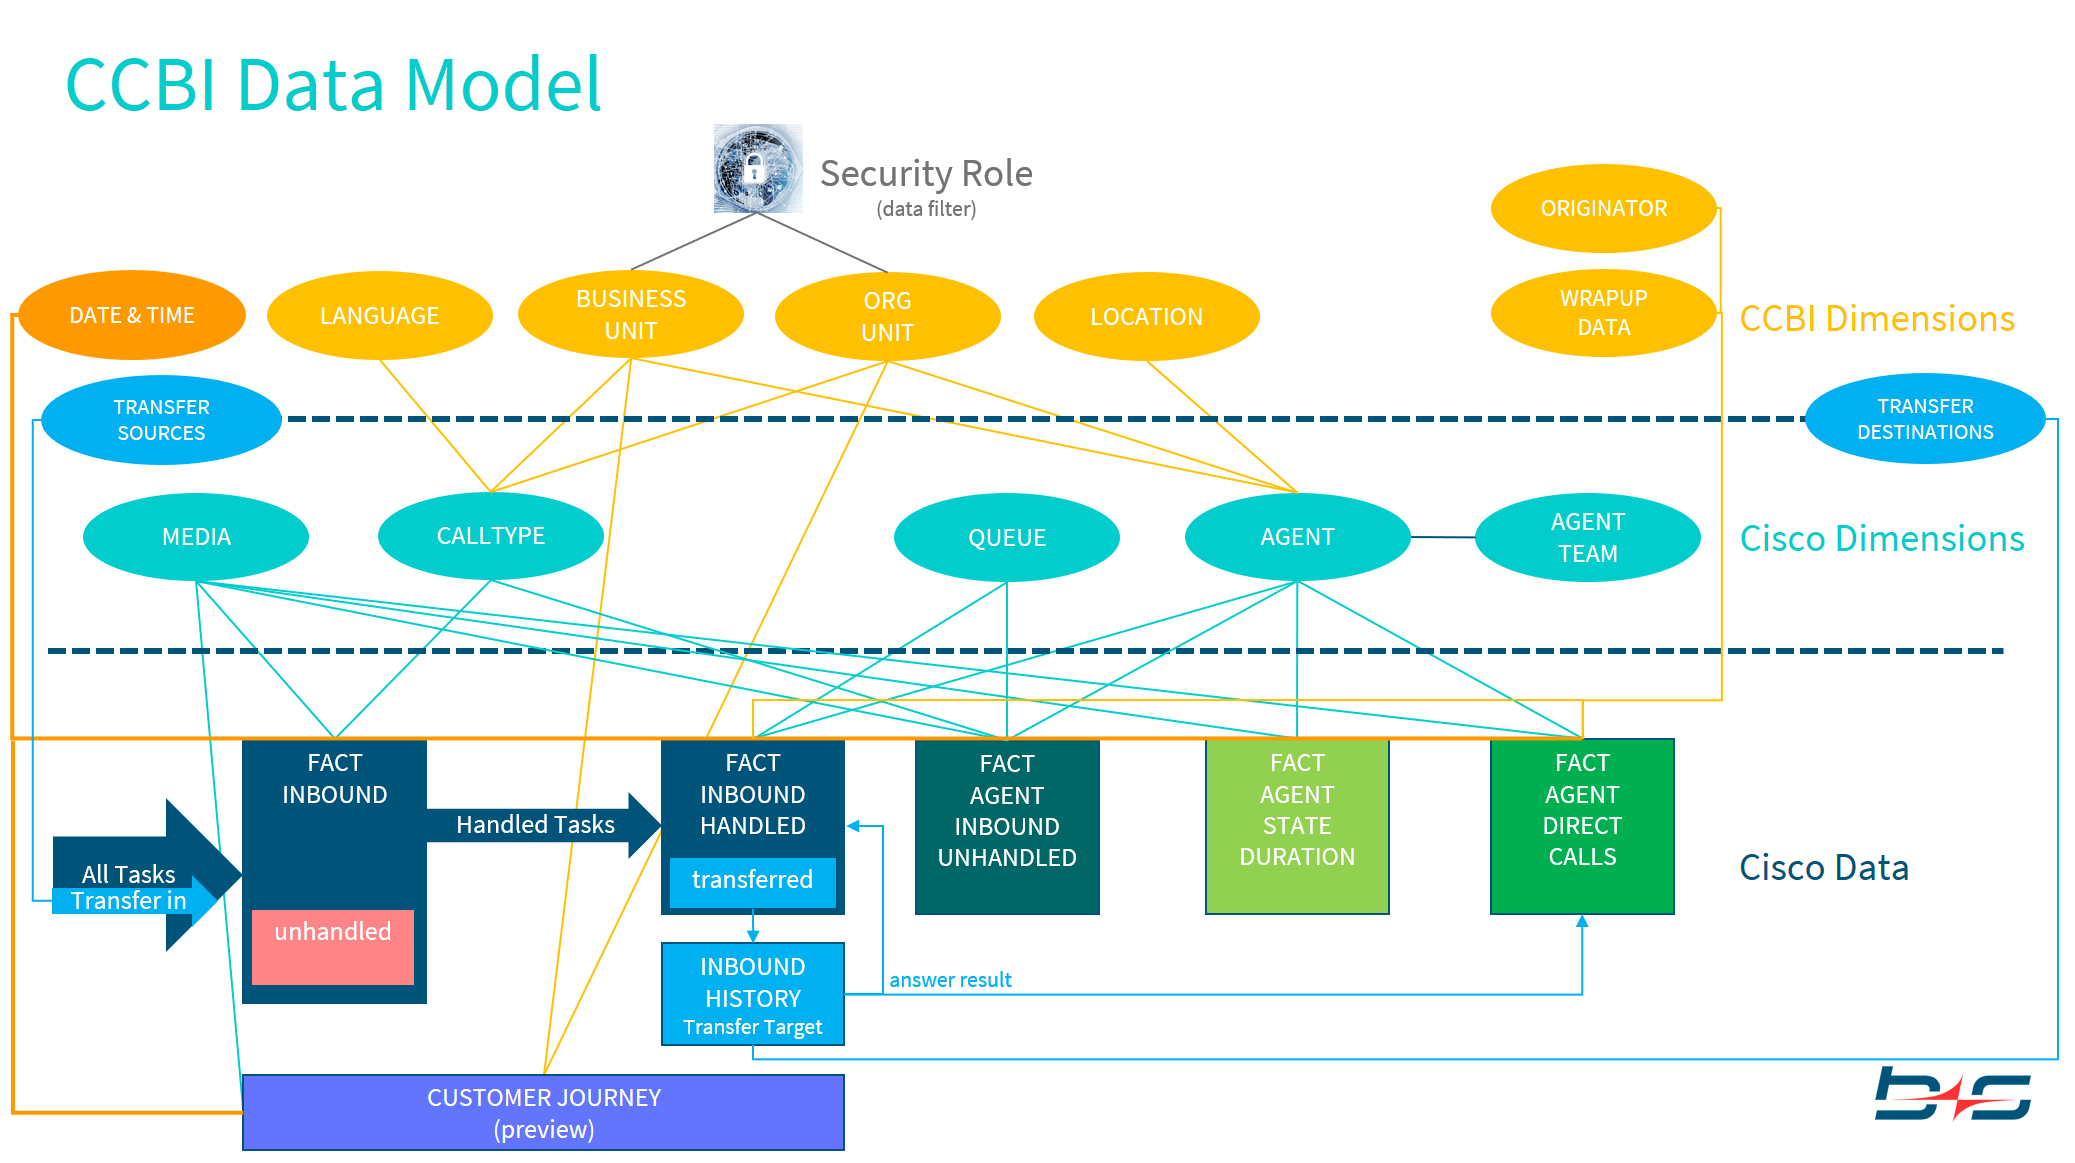
Data Model
This report is included for documentation purposes and displays the available data model and especially how fact data is filtered through the available dimensions.
Dimensions
This Report can be used to verify the CCBI Dimension configuration and the assignments to the Cisco Dimensions "CallType" and "Agent".
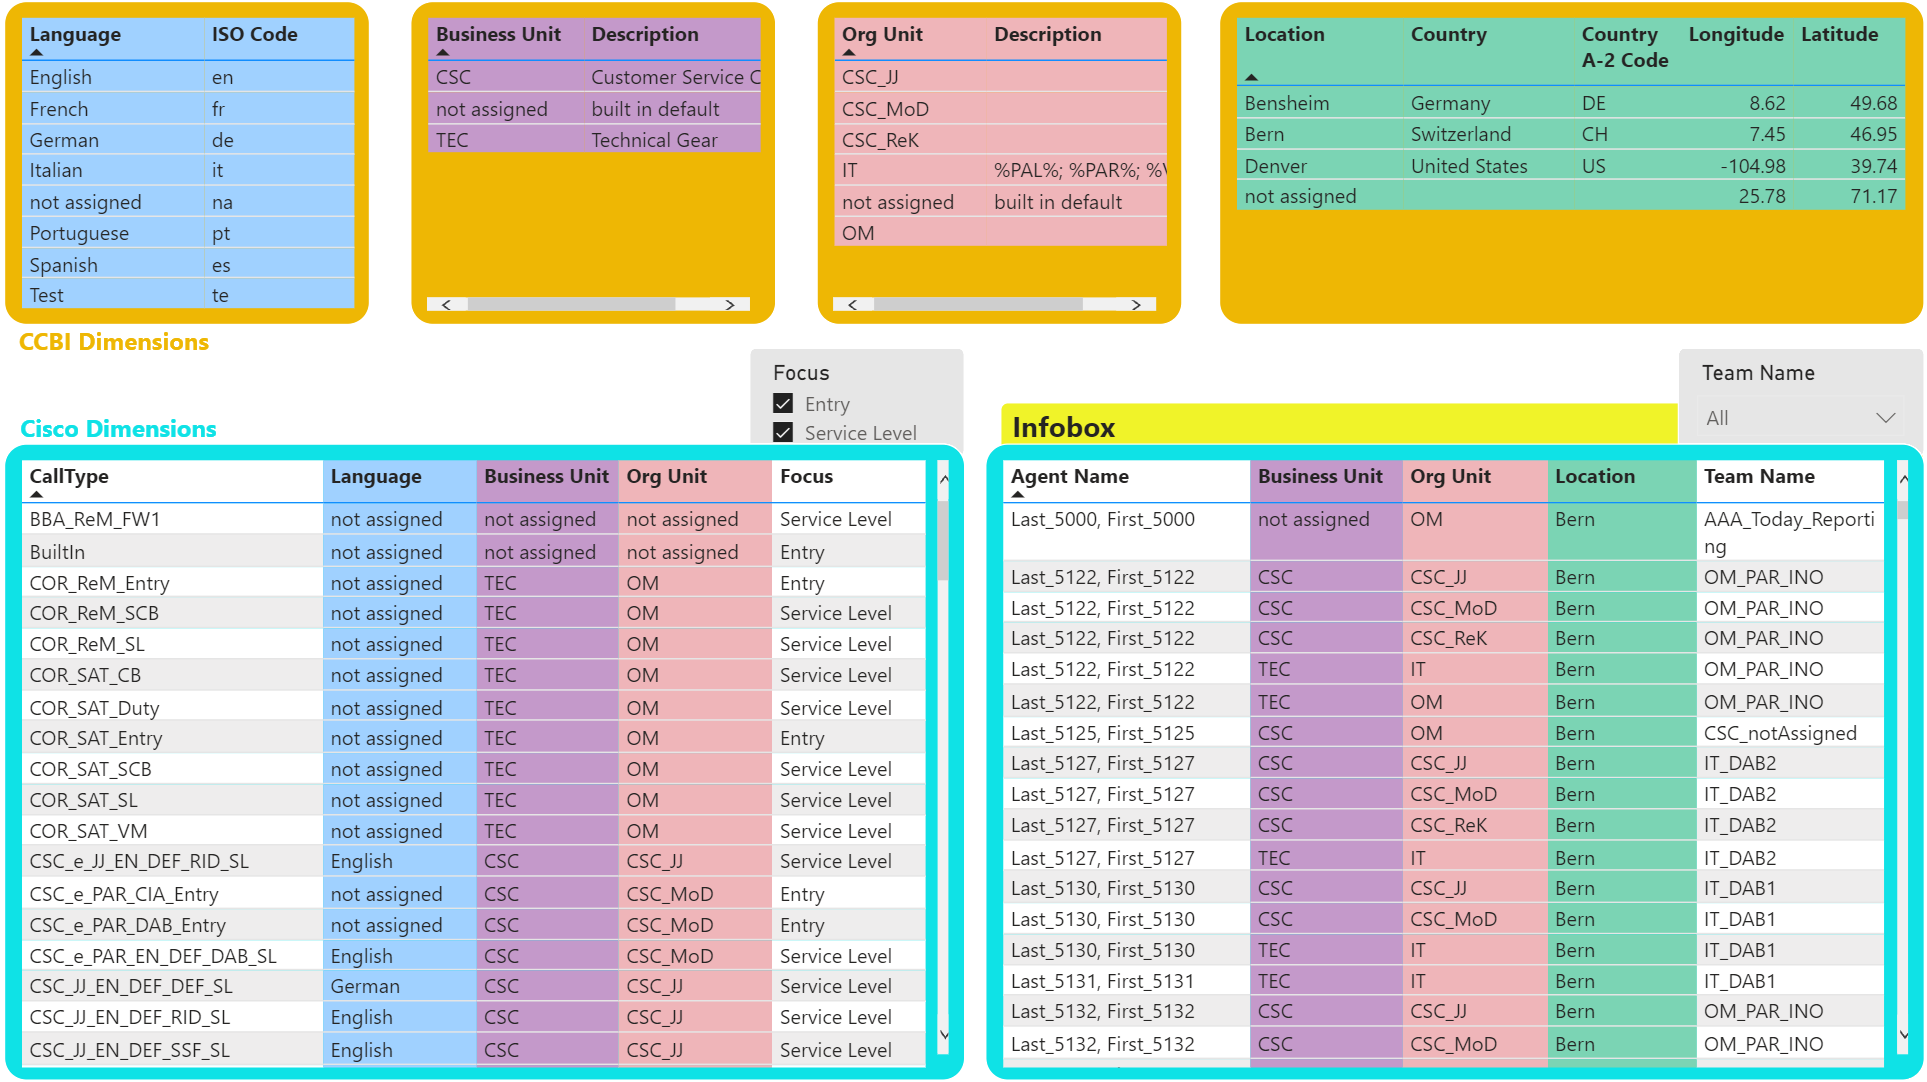
If you select one of the CCBI Dimensions on top, data is filtered into the corresponding tables below.
If you select one of the "not assigned" Dimensions, you can find the objects where the mapping is missing within the database.
Focus: Use the slicer to select and verify the Service Level relevant objects
Team: Use the slicer to select Agents based on Teams. Notice that the agent to team assignment is done within the CCE system.